HISAs are “High Interest Savings Accounts” and offer a nearly zero risk, highly liquid way to earn some interest on your cash holdings. If your broker doesn’t give you access to HISAs (or you have to pay large transaction fees to acquire them), then there’s also ETFs that fit the bill, and some of them are now in this table, too.
Since there’s no central bank meetings until the very end of this month, most of the September 2025 version of this table applies. The exception are the ETFs, which publish new yields monthly, so those figures are updated in the table below:
| Provider | Fund | Link | Rate Sheet | Rate |
|---|---|---|---|---|
| RBC | RBF2011, RBF2021, RBF2031, RBF2041 | RBC | Link | 2.30% |
| Scotiabank | DYN6004, DYN5004, DYN3065, DYN3055, DYN3075 | Scotiabank | Link | 2.45% |
| Equitable Bank | EQB1001, ETR1001 | Equitable Bank | n/a | 2.30% |
| TD | TDB8151, TDB8156, TDB8158, TDB8160 | TD | n/a | 2.30% |
| Renaissance | ATL5071 | Renaissance | n/a | 2.30% |
| Home Trust | HOM101, HOM201 | Home Trust | Link | 2.40% |
| B2B | BTB101 | B2B Bank | n/a | 2.40% |
| Manulife | MIP610, MIP810 | Manulife | n/a | 2.15% |
| National Bank | NBC200, NBC6200, NBC8200 | NBI Altamira CashPerformer | n/a | 2.30% |
| Global X | CASH | CASH Fact Sheet | n/a | 2.39%1 |
| Evolve | HISA | HISA Fact Sheet | n/a | 2.39%2 |
| BMO | ZMMK | ZMMK Fact Sheet | n/a | 2.76%3 |
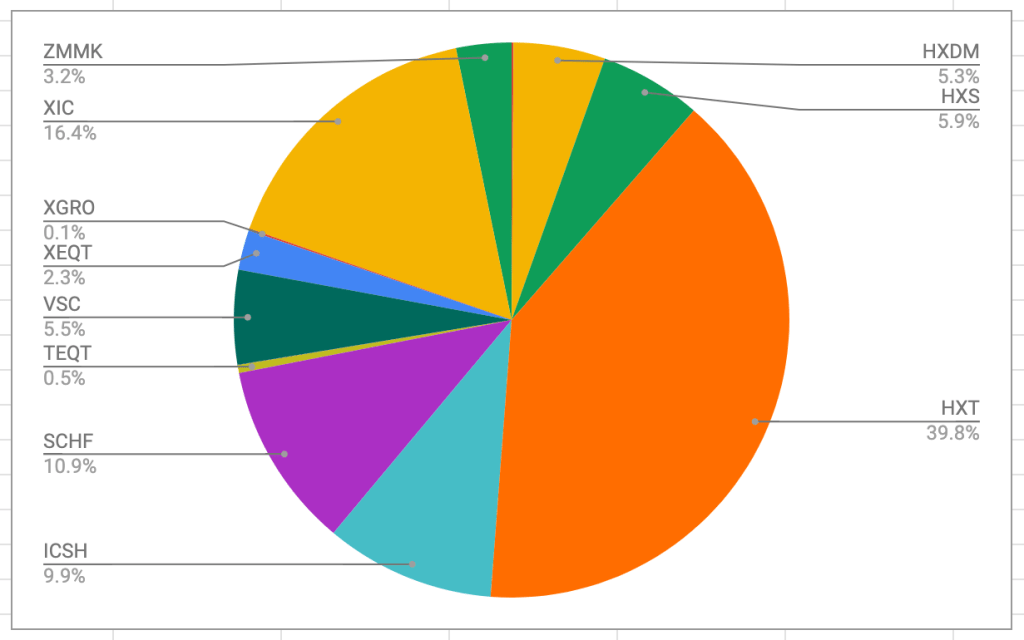
ZMMK is a very short-term bond fund that carries more risk than a HISA, but gives a slightly better return as a result. ZMMK appears in my ETF All-Stars list.
Since I hold a substantial amount of USD-denominated ETFs, I also track US interest rates.
| Provider | Fund | Link | Rate Sheet | Rate |
|---|---|---|---|---|
| RBC | RBF2015 | RBC | Link | 3.90% |
| Scotiabank | DYN6005, DYN5005 | Scotiabank | Link | 3.90% |
| Equitable Bank | EQB1101, ETR1101 | Equitable Bank | n/a | 3.80% |
| TD | TDB8153 | TD | n/a | 3.90% |
| Renaissance | ATL5075 | Renaissance | n/a | 3.90% |
| Manulife | MIP611 | Manulife | n/a | 3.05% |
| National Bank | NBC201 | NBI Altamira CashPerformer | n/a | 3.90% |
| Global X | UCSH | UCSH Fact Sheet | n/a | 3.96%4 |
| Evolve | HISU | HISU Fact Sheet | n/a | 3.96%5 |
| iShares | ICSH | ICSH Fact Sheet | n/a | 4.48%6 |
UCSH and HISU invest in HISAs exclusively; I instead use ICSH which is a rough equivalent of ZMMK in terms of portfolio makeup. Like ZMMK, I enjoy a slight premium in yield as a reward for taking a bit more risk.