These rates underpin things like the HISA table I update monthly; as a result, I wouldn’t expect much in the way of change for my upcoming August update.
The next announcements from the two are scheduled for September 17.
I have a dedicated non-registered account in my retirement portfolio that is the cash cushion for VPW’s decumulation strategy. You can read about the details of how I currently get paid in retirement here.
That non-registered account holds about 85% Canadian dollars, invested in ZMMK, with the remaining 15% invested in ICSH. Both of these ETFs are very short-term bond funds and give me a slight advantage over investing in zero-risk HISAs. ZMMK and ICSH are part of my ETF all-stars lineup, and I track HISA rates on a monthly basis.
The fact is that US interest rates are a lot higher than Canadian interest rates, almost 2% higher as of July 2025. It seems to me that I should take advantage of that fact. Taking advantage of this situation would mean selling some ZMMK, performing Norbert’s Gambit with the resultant cash, and then buying ICSH. There are costs involved at every step of the way1:
Selling ZMMK means I’ll get dinged with the bid/ask spread2
Performing Norbert’s Gambit costs $9.95 plus HST on Questrade to do the necessary journaling
There will be bid/ask spreads to pull off the Gambit…once when buying DLR, once when selling DLR.U
Buying ICSH means another bid/ask spread
So at what point is it worth it? Let’s do a bit of math using the following assumptions:
The delta between US and Canadian rates is 1.8% in favor of the US rate. That’s an annual rate, and I’ll just divide by 12 to get a monthly rate3.
The bid/ask spread for DLR per the ETF fact sheet is 0.1% on the CAD side and 0.07% on the USD side
So clearly, for amounts around $1k this isn’t such an attractive proposition as the costs will take a fair bit of time to be negated by the bump in interest rates. For larger amounts, I’d say it’s worth it. Given ZMMK hasn’t yet paid out its dividend for the month, I guess I’ll wait until I’m ex-dividend (July 30, 2025, per the fact sheet) before doing this transaction.
I’m also ignoring the tax on any capital gains I might pull off. It will be quite small, and will be close to 0. ↩︎
Bid/ask spread is the difference between what the price holders are willing to sell at versus the price offered by a buyer. For ZMMK this is typically 1 cent. ↩︎
Whether this delta continues to hold is anybody’s guess. ↩︎
Which, admittedly, has no hope of being correct. If you do this sort of thing frequently enough, it ought to even out over time. ↩︎
This is true at Questrade. YMMV with your broker. ↩︎
You can read about my asset-allocation approach to investing over here.
The view as of this morning
As of this morning, this is what the overall portfolio looks like:
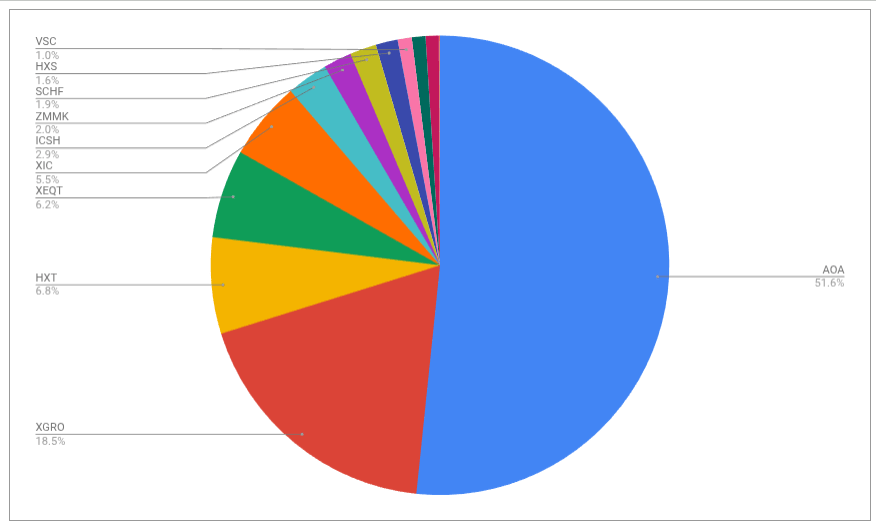
Retirement holdings by ETF, July 2025
The portfolio is dominated by my ETF all-stars; anything not on that page is held in a non-registered account and won’t be fiddled with unless it’s part of my monthly decumulation. Otherwise I’ll rack up capital gains for no real benefit.
There weren’t big changes this month. My monthly decumulation from my RRIF accounts involves selling enough XGRO to meet RRIF-minimum payments, and the rest of my retirement paycheque is funded by my non-registered accounts. This month, given the run in the US stock market of late, that involved a sale of some shares of HXS1.
Plan for the next month
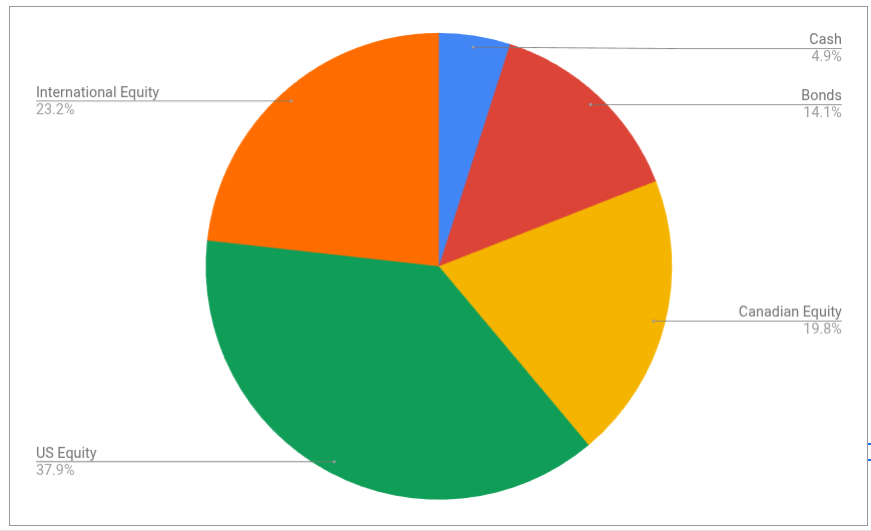
The asset-class split looks like this
The bond portion of the portfolio is a little smaller than I would like. The targets for my portfolio are unchanged:
5% cash or cash-like holdings like ICSH and ZMMK
15% bonds (almost all are buried in XGRO and AOA)
20% Canadian equity (mostly based on ETFs that mirror the S&P/TSX 60)
36% US equity (dominated by ETFs that mirror the S&P 500, with a small sprinkling of Russell 2000)
24% International equity (mostly, but not exclusively, developed markets)
The change in the bond portion of the portfolio was amplified because I hadn’t updated the asset split of AOA in my multi-asset tracker in a while. AOA has drifted quite a bit since it only rebalances twice a year (next time in October). More on drifting in multi-asset ETFs here.
Overall
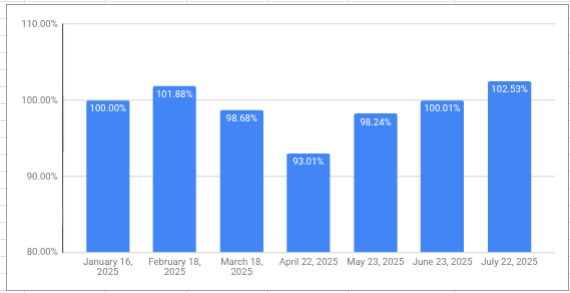
The retirement savings look quite healthy; even though I’ve been drawing a monthly salary for 7 months, I’m now ahead of where I was when I started my retirement journey. This is aligned with what my retirement planner told me to expect, but as you can see, the journey has had some interesting ups and downs already.
Monthly retirement savings, as percentage of Jan 2025 value
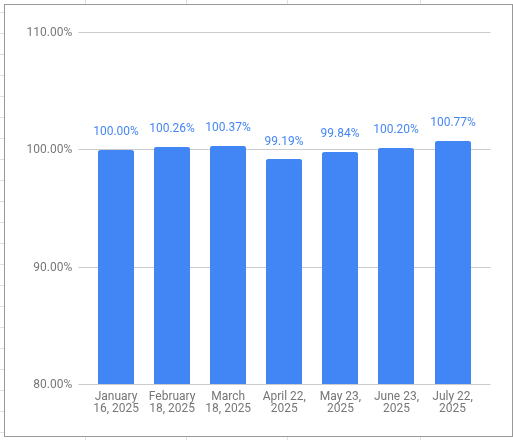
My VPW-calculated salary has hit a new high this year, a dizzying 0.77% higher than my first draw in January. This stability is thanks to the built-in shock-absorber of the VPW model (a 6-month cash cushion which smooths out the market gyrations considerably). I also think it’s an endorsement of my choice to take retirement payments monthly; my exposure to short-term market hiccups is greatly reduced since I’m not making big sales of ETFs to fund a year of spending all at once.
Monthly salary, as percentage of Jan 2025 salary
Which particular ETF I sell from my non-registered portfolio is based on what asset class is the most overweight at that point in time. If it’s US Equity, then I sell US Equity. If it’s Canadian Equity, then I sell Canadian Equity. ↩︎
I rely a lot on asset-allocation ETFs in my retirement portfolio, mostly XGRO in the CAD side of the portfolio and AOA on the USD side1. These ETFs (about 70% of my overall retirement portfolio, as you can see here), like all asset-allocation ETFs, rebalance their holdings periodically in order to stick to their asset allocation targets. This aligns perfectly with my way of investing; I’ve always tried to stick to my asset allocation targets portfolio-wide, assisted by tools like my multi-asset tracker spreadsheet. (If you aren’t familiar with asset-allocation as an investment strategy, you could give this article a read.)
XGRO’s asset allocation targets are written right in the prospectus2:
80% Equity, with 36% US equity, 20% Canadian Equity, 20% International Developed Market Equity, 4% Emerging Market Equity.
20% Bonds, 16% being held in Canadian bonds. The other 4% are designated “non-Canadian” but seems like it’s always US bonds.
Anyway, XGRO’s approach to making changes to the portfolio in order to maintain this target percentage is written in the prospectus too:
XGRO’s portfolio will be monitored relative to the asset class target weights and will be rebalanced back to asset class target weights from time to time …XGRO’s portfolio is not expected to deviate from the asset class target weights by more than one-tenth of the target weight for a given asset class
Page 419 of the iShares Prospectus (June 2025)
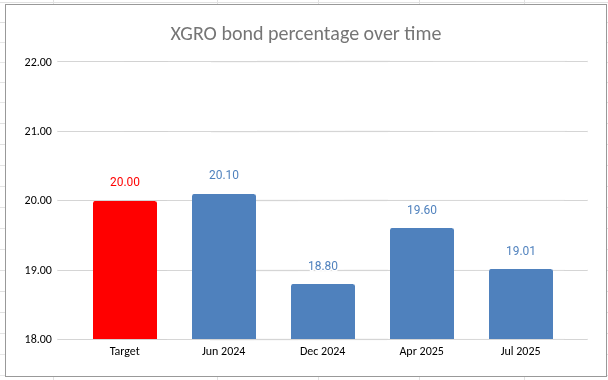
Now “from time to time” isn’t terribly precise. I thought I’d take a closer look at the history of XGRO’s asset allocations. So I dug through annual and semi-annual reports as well as the website. I focused on the Fixed Income (aka Bond) proportion of XGRO over time because that’s the asset class that’s most likely to drift lower3…equities typically outperform fixed income historically. So this is what I found:
So there is a bit of drift in the fixed income portion of XGRO, but in the past year I haven’t seen it off by more than 1.2%, meaning that the promise made in XGRO’s prospectus is being adhered to.4
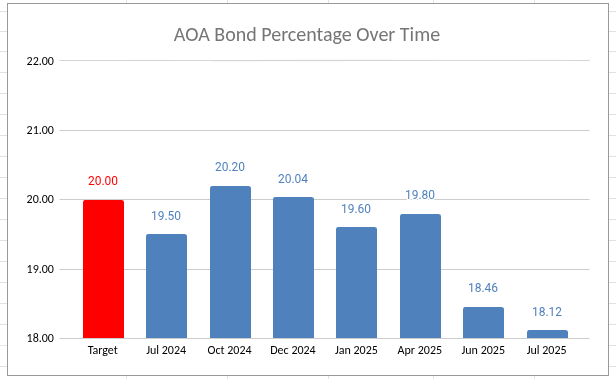
Turning now to AOA, the fixed income proportion is clearly stated to be 20%, and rebalancing is stated to happen twice annually, in April and October. After that, things become a bit harder to work out56. The various equity contributions are determined by the target index, namely the S&P Target Risk Aggressive Index, which are constructed by using market capitalization of the various indices used7.
Anyway, like XGRO, what I’m most concerned about is the fixed income portion of AOA, and digging through the various reports, I came up with this:
Of late, the fixed income portion AOA has become small, almost 2% lower than it should be. And given that AOA is about 50% of my holdings, it means that my equity exposure is quite a bit higher than I would let it drift myself.
I suppose the next rebalancing in October 2025 will correct this, but I admit it makes me a little uneasy to see that sort of volatility in the asset allocation8. I could of course just sell some AOA and reinvest it in some bond fund (AOA uses IUSB and IAGG, which seem like fine choices) but then I’m just working around the asset allocation strategy I’m paying for in AOA’s management fees, which seems dumb. Not to mention that anything I do now will almost certainly have to be undone come October.
So I guess this all means I should just let sleeping dogs lie. I have minor bits of money to reinvest every month (I still contribute to my TFSAs) so using those funds to buy bonds are probably what I’ll do. It’s a tiny pre-correction that should be addressed come October…or by the next equity meltdown.
And since detailed targets are clearly stated, these are the percentages I assume for XGRO in my multi-asset tracker spreadsheet. I could continually update the percentages since they calculated daily on XGRO’s page, but it seems like busywork. ↩︎
My retirement decumulation strategy (VPW) relies on knowing what my asset allocation is, too ↩︎
It does mean, however, that my equity exposure Is higher than I thought. ↩︎
Well, or maybe I’m just not that smart — I’m not really sure if one can calculate the market caps needed to work out the allocations. ↩︎
And unlike XGRO, I actually do track (from time to time) the underlying allocations of AOA so that my multi-asset tracker reflects reality. It was through my most recent update that I discovered that the bond portion of AOA was a lot lower than it had been. ↩︎
Namely the S&P500, the S&P MidCap 400, the S&P SmallCap 600, the S&P Developed Ex-U.S. BMI, and the S&P Emerging BMI ↩︎
It’s still within the stated drift that XGRO tolerates, however. So maybe I’m overthinking this. ↩︎
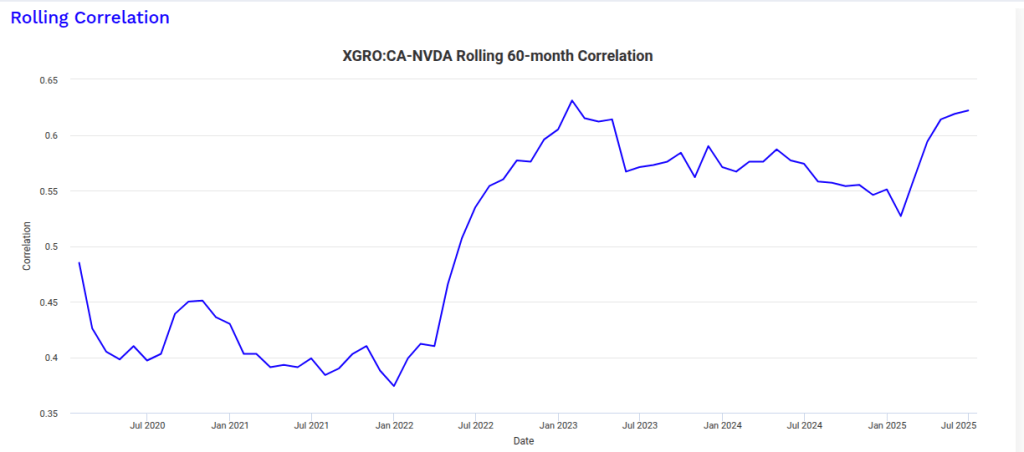
One nagging concern I’ve heard about index investing1 is that you can end up overly concentrated in a handful of stocks. For example, as of today, per XGRO’s fact sheet, for every $100 I have invested in XGRO, I’m actually investing almost $5 between two companies, NVIDIA and Microsoft. And for every $100 I have invested in AOA, it’s $7 in these two companies. Although that sounds like it might be a significant concentration, I found a way to test the correlation using https://www.portfoliovisualizer.com/asset-correlations. As you can see, XGRO and NVIDIA are not terribly well-correlated:
Not very strong correlation between XGRO and NVIDIA
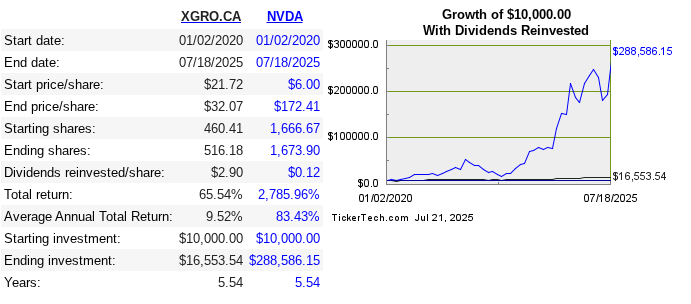
…even though perhaps I perhaps wish they were (sigh):
Wishing XGRO was more strongly correlated with NVIDIA…
Anyway, if you’re still not comfortable with having too much concentration in your holdings, there are ETFs that limit exposure to any one stock in an index. iShares launched an ETF last year that tracks the S&P 500 while limiting the contribution of any member of that index to 3%. That product is called XUSC, which serves as a complement to its XUS uncapped S&P 500 ETF2. So when you compare XUS’s top holdings to those of XUSC, you can quickly spot the difference:
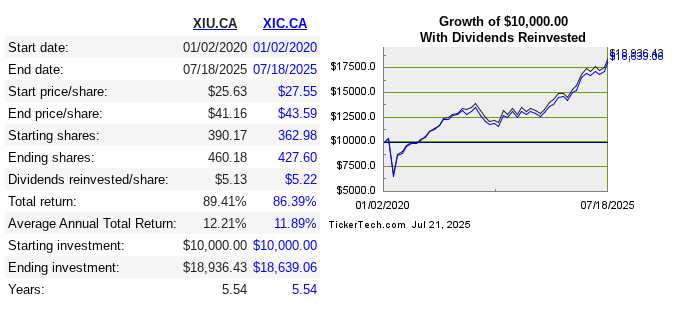
XIC holds a lot more companies, and in addition to capping any single company, this has the effect of shifting the emphasis to smaller companies. So does this make a big difference in performance? Let’s check using this calculator.
So not much difference; over the past 5.5 years, we see a very slight edge to XIU, the uncapped TSX60 fund.
Whether the relationship between XIU and XIC will be the same as XUS/XUSC is anybody’s guess. In my own case, I don’t own the capped version of the S&P 500, but I do own XIC over XIU, mostly because of its significantly lower MER (0.06% versus 0.18% for XIU).
And my biggest holdings (AOA and XGRO) are nothing more than a collection of index funds: S&P 500, TSX, MSCI EAFE… ↩︎
There’s also currency-hedged variants of these, but I never bother with hedging, it just adds expense and tracking errors. ↩︎
You may wonder why an ETF that advertises itself as capping components at 3% has components that exceed 3%. I also have this question. I suppose they probably only trade when the exception is maintained for a period of time, or perhaps by a more significant margin. Otherwise, they’d trade stocks that hovered around the 3% threshold excessively. ↩︎
The “C” is either for “Capped” or “Composite”, you decide. ↩︎
I can’t explain why a “TSX 60” ETF has 61 assets. Maybe they count cash as the 61st? ↩︎