Since my investment strategy is to own the market via passive index investing, I know that some of my retirement savings are tied up in those famous seven tech stocks1. But that’s not what I’m talking about.
For a year or so I’ve been talking about my ETF All-Stars, but I’ve come to the realization that the list isn’t complete. I discovered that I could do better in terms of where I hold certain assets, I’ve now also realized that I need 7 total ETFs to achieve my investment objectives across non-registered, TFSA and RRIF accounts. These seven ETFs are 90% of my retirement portfolio. The other 10% are found in the non-registered account and are legacy investments. Over the next 5 years, these legacy investments will disappear altogether.
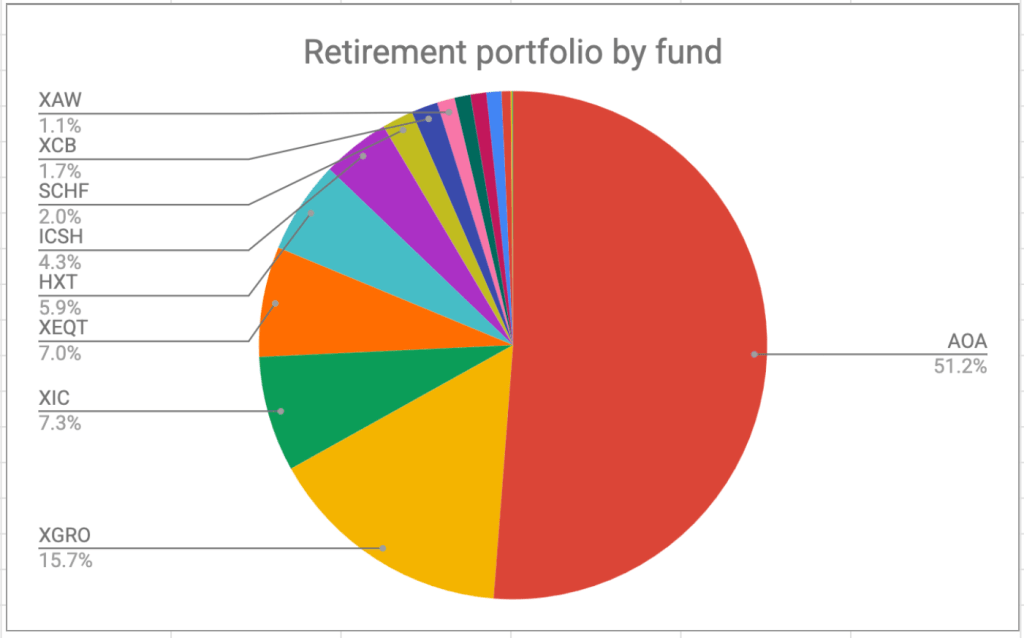
Here’s how the seven2 break down:
AOA: An all-in-one USD ETF
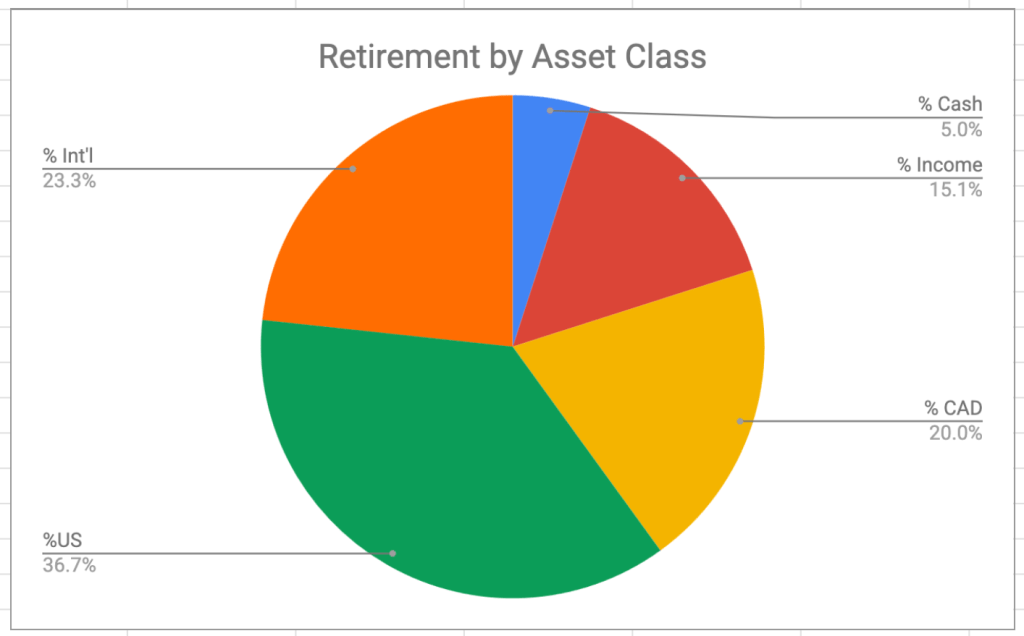
AOA is an 80% Equity / 20% bond ETF. It’s roughly 50% of my retirement savings, and it’s exclusively held in my RRIF accounts. I’ve invested in USD ETFs for quite a long time now, and this one holding locks up most of my USD funds. The problem with AOA is that it tilts too far into US Equities (50%) and has very little exposure to the Canadian stock market (about 2.67%). So I have to compensate elsewhere.
XGRO: An all-in-one Canadian ETF3
XGRO is an 80% Equity/ 20% bond ETF, about 15% of my retirement savings. It’s the Canadian sibling of AOA in every way. It holds 20% Canadian equity and 36% US equity, so it helps take down the US bias of AOA a bit. It’s held exclusively in my RRIF accounts.
XEQT: An all-in-one Canadian ETF
XEQT4 is from the same family as XGRO but doesn’t hold any bonds. It helps take down the bond percentage of my overall portfolio from 20% to 15%. Since equities tend to grow faster than equity/bond combinations, and since my TFSA is the last account to be touched in my retirement income planning, XEQT is held only in my TFSA accounts.
XIC: A low-cost Canadian Equity ETF
XIC5 holds only Canadian Equities and helps fix the lack of Canadian content in AOA. As a 100% equity ETF, it lives mostly in my TFSA. Historically, I also hold this in my non-registered accounts but this will be reduced as I dip into my non-registered funds to pay my bills.
ICSH: A USD money-market fund
Technically, ICSH is an ultra-short-term bond fund, but I treat it the same way as I would treat a HISA. Cash is 5% of my portfolio in retirement, and it’s mostly in ICSH since US Interest rates are much higher than Canadian ones at present. I’d switch this holding to ZMMK if the opposite was true. ICSH lives both in my RRIF and my non-registered accounts. It’s only in my non-registered accounts because my decumulation strategy (VPW) requires a “cash cushion” to smooth out my monthly salary.
XCB: A Canadian Corporate bond fund
The way the math works at present, I’m a little short in bonds, and so I have a bit of XCB sitting in the RRIF to keep my asset targets in line. XCB is a nice low-cost corporate bond fund; I chose corporate because AOA and XGRO give me plenty of exposure to government bonds.
ZMMK: A CAD money market fund
ZMMK is a small portion of the cash cushion which is mostly invested in ICSH. If Canadian interest rates exceed US rates, then my holdings here would grow accordingly.