Investment basics: Asset Allocation

We’ve talked about asset allocation / asset classes before in this space, most recently here. But while watching a recent post1 from one of my favourite experts, The Loonie Doctor2, it occurred to me that it might be helpful to start right from the beginning.

And to me, that beginning is understanding WHAT to invest in. Broadly speaking, you can choose between three categories: “Equity”, “Bonds” and “Cash”.

“Equity” refers to stocks of publicly traded3 companies. Owning stock means you own a piece of the company you invest in. This allows you to collect dividends if and when the company pays them out. If the company fails/goes bankrupt, the stock becomes worthless.

“Bonds” are essentially loans to companies or governments4. When you buy a bond, you’re buying into a stream of interest payments that stop when the bond is paid off. If a company who issued the bond fails/goes bankrupt, bond holders legally get first dibs on whatever assets remain in an effort to get their money back, but it’s possible that there isn’t anything left to fight over. Bonds can be fully paid off in various timeframes, from very short (30 days) to very long (20 years).

Cash” is the money that’s left. Cash can be invested in things like high interest savings accounts, GICs/Term Deposits, Treasury bills (aka T-Bills), or stuffed under a mattress5. There is definitely a grey area between “Cash” and “Bonds” since both involve lending money to an entity. Shorter duration loans are more cash like. Lending to governments and large corporate entities (like banks, which is what you’re doing when you buy a GIC) is more cash-like. Money under a mattress is absolutely cash, albeit not really an investment at that point.

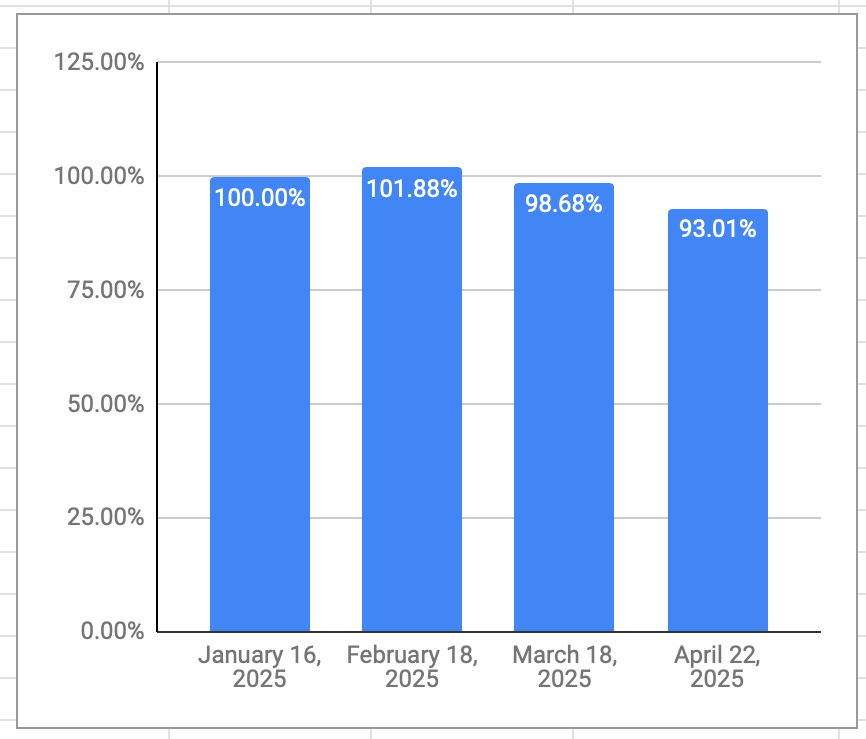
Using the data tabulated here, you can build a chart like the one below to see how much the $1000 investment you made in each of these categories would be worth 50 years later6.

The chart shows that Equities outperform Bonds and Cash by a wide margin when looking at an investment time period of 50 years. Bonds also outperform Cash substantially.
Historical returns for Canadian equities, bonds, and cash (as of December 2024)

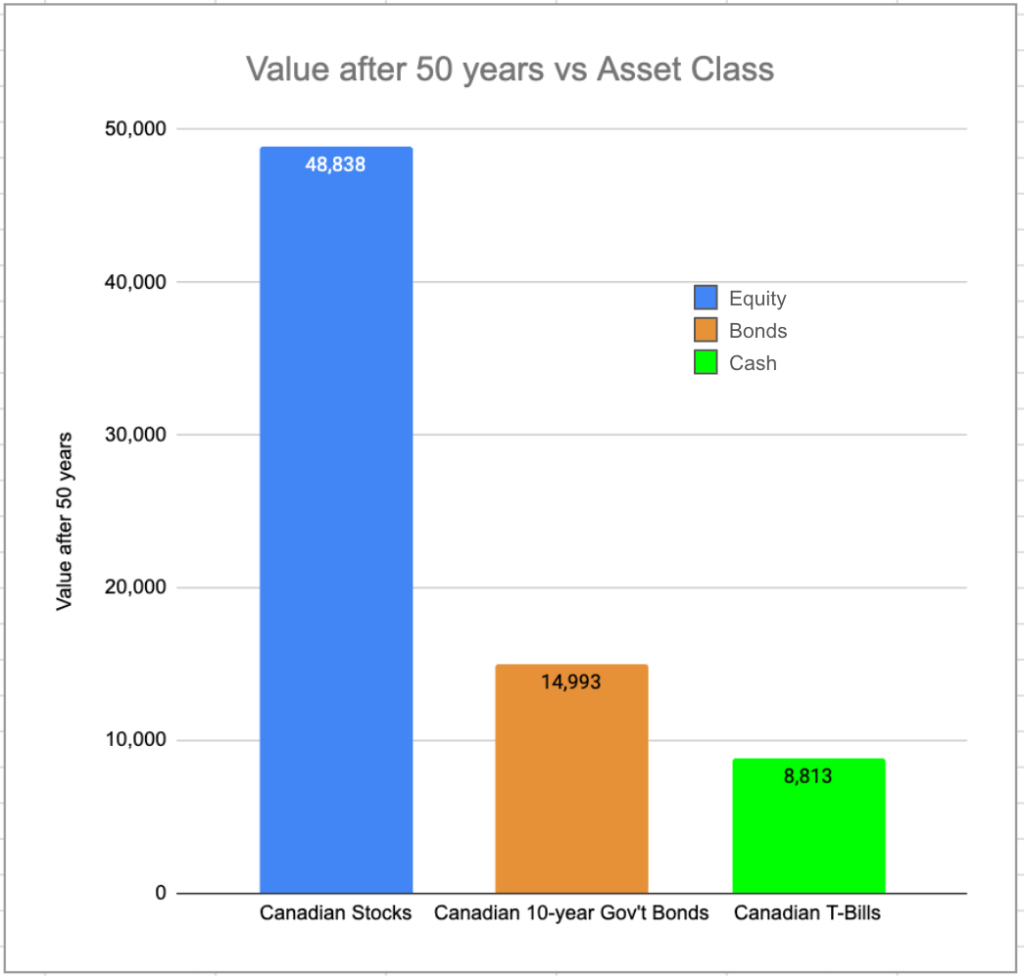
Looking at this chart, it should be reasonably obvious that equities, represented here by Canadian Stocks, over time, generate the best bang for your invested buck. The “over time” phrase is very important, because otherwise, one could rightly ask, “why would anyone ever invest in anything other than stocks?”. The reason is volatility — in any given short time period, your returns could look very, very bad indeed. Just one example (of many) — the TSX has LOST money in 3 of the last 10 calendar years per https://en.wikipedia.org/wiki/S%26P/TSX_Composite_Index.

Bonds, generally speaking7, have a much steadier and predictable return, often uncorrelated with stocks. When stocks go up, bonds often move in the opposite direction. And cash, well, its benchmark is the inflation rate. If cash is returning the inflation rate8, then at least you’re standing still.

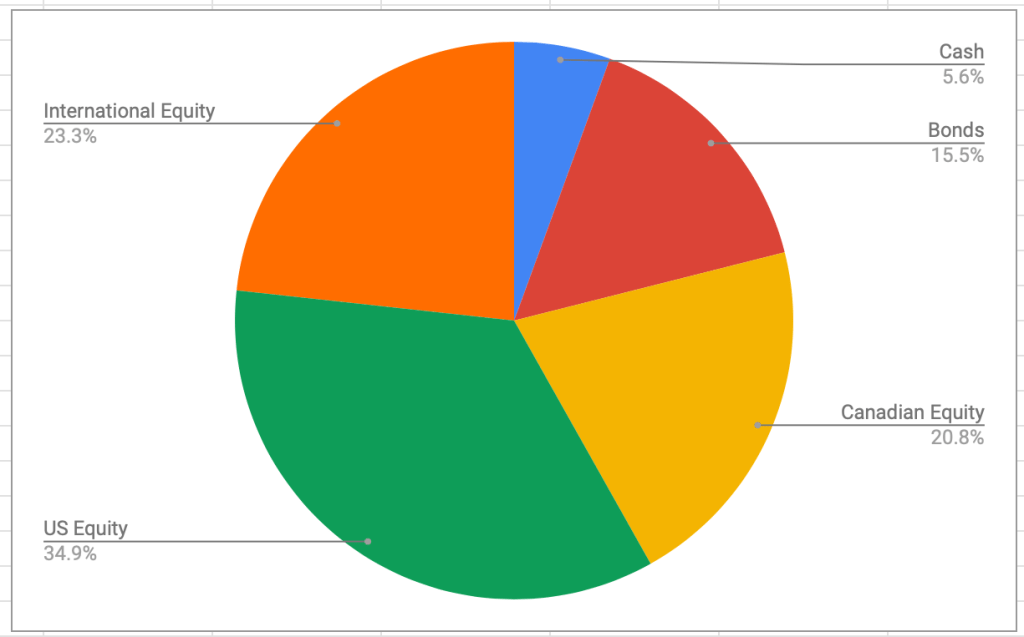
In my investment portfolio, my target allocations are 80% Equity, 15% Bonds, 5% Cash. Using products like all-in-one ETFs and my handy-dandy multi-asset tracker spreadsheet make this relatively easy to track. In my next post, I’ll show how to identify ETFs in each of the categories.

  1. Which provides further justification that using all-in-one ETFs is really the best approach. ↩︎
  2. Which, while positioning itself as being for doctors, has a ton of useful information for those of us who are not physicians as well. ↩︎
  3. And of course it is possible to buy stock in private companies (so-called private equity) but since I don’t know very much about that world, I figured I’d keep it simple and just talk about things that are available to the general public. ↩︎
  4. And the financial stability of those companies and governments can vary a lot. That’s where bond rating services can point you to higher quality entities (with a low risk of not paying) or lower quality entities (with a higher risk of not paying, but a better interest rate — the bottom of the barrel here are called “junk bonds”). ↩︎
  5. AKA “the chequing account of most major banks”, which don’t pay any interest ↩︎
  6. For “Canadian Stocks” this is the TSX Composite index (former name: TSE 300). “Canadian Bonds” is 10 year Government Bonds. ↩︎
  7. Let’s forget 2021-2 ever happened to the bond market. ↩︎
  8. And it doesn’t always do so! ↩︎

Is XEQT shift a reason to be concerned?

Quite a lot of my portfolio is tied up in all-in-ones. My Canadian holdings are dominated by XGRO. (If you’re new to the concept of all-in-ones, you may want to give this a read.) I noted with interest a post this week about how XEQT was shifting investments from ITOT to XUS. In plain English, the post was concerned about XEQT’s US holdings moving from the “total” US stock market (ITOT is a mix of small, medium and large companies) versus the S&P 500 (XUS holds the largest 500 companies in the US.)

Now, I don’t hold a ton of XEQT1 (which is 100% stocks); instead, I prefer to hold XGRO, which up until now, I figured was (in my simple way of thinking about such things) “XEQT, except with 20% in bonds”.

The post made me look to see if the report was accurate2. Sure enough, referring to the “Holdings” section of both ETFs, you can see the difference easily.

TickerNameXEQT WeightXGRO weightXGRO Adjusted Weight
ITOTIShares Core S&P Total US Stock34.35%35.16%43.73%
XEFIShares MSCI EAFE IMI26.33%20.76%25.82%
XICIShares S&P/TSX Capped Composite25.88%20.55%25.56%
XECIShares MSCI Emerging4.97%3.93%4.89%
XUSIShares S&P 5008.28%0%0%

“XGRO adjusted weight” takes into consideration that you can’t just compare the weight of a given equity component since XGRO is roughly 20% bonds. “XGRO Adjusted weight” can be read as “the % contribution of this stock to the equity portion of XGRO”. This allows an apples to apples comparison between XEQT and XGRO.

Clearly, there’s 8.28% that XEQT is investing in the S&P that isn’t in the XGRO portion. So this means that XEQT has a slight bias towards the larger portion of the US stock market over XGRO. I like diversification, so I was mildly concerned that perhaps this wasn’t a good idea. So I did some number crunching by downloading the detailed assets from both of these ETFs.

And this is what I found

Comparing % contribution of the largest US holdings of XGRO and XEQT, April 2025

So while there are some differences in the largest stocks I looked at, there wasn’t a consistent bias towards the large stocks. In fact, the sum of the “difference” column shown here is precisely zero.

But why? Shouldn’t XEQT’s double purchasing of large US stocks (via both ITOT and XUS) result in a bias towards the large US stocks at the expense of smaller US stocks? It should, but right now, at the moment, it doesn’t.

This is because XGRO, at the moment, actually has a slightly larger US bias than XEQT, and both of them are actually below target (as per their reference guide):

Current XEQT US equity weightTarget XEQT US Equity WeightCurrent Adjusted XGRO US equity weightTarget Adjusted XGRO US Equity Weight
42.63%45%43.73%45%

This, I suppose, will wash out in the coming weeks/months as both XGRO and XEQT buy up more US stocks to get closer to their targets. In short, there isn’t anything to worry about in the near term; in the longer term, owning XEQT will probably tilt the US equity bias a bit towards larger stocks, which I’m not too fussed about.

  1. I do have a growing amount here because otherwise I’d have a hard time keeping my bond allocation to the desired 15% of my portfolio. ↩︎
  2. I believe this is called “doing the research”. ↩︎

What’s in my retirement portfolio (April 2025)

This is a (hopefully monthly) look at what’s in my retirement portfolio. The original post is here. Last month’s is here.

Portfolio Construction

The retirement portfolio is spread across a bunch of accounts:

  • 7 RRIF accounts (3 for me, 3 for my spouse, 1 at an alternative provider as a test)
  • 2 TFSA accounts
  • 3 non-registered accounts1, (1 for my spouse, 2 joint)

The target for the overall portfolio is unchanged:

  • 80% equity, spread across Canadian, US and global markets for maximum diversification
  • 15% Bond funds, from a variety of Canadian, US and global markets
  • 5% cash, held in savings-like ETFs.

The view as of this morning

As of this morning, this is what the overall portfolio looks like:

Overall retirement portfolio by holding, April 2025

The portfolio, as always, is dominated by AOA and XGRO which are 80/20 asset allocation funds in USD and CAD, respectively. The rest are primarily either cash-like holdings in two ETFs: ZMMK in CAD and ICSH in USD) or residual ETFs held in non-registered accounts for which I don’t want to create unnecessary capital gains just for the sake of holding AOA or XGRO.

The biggest month over month change was a small decline in AOA and a small uptick in XEQT, about a 1% shift overall. This was because I shifted some of my USD assets to CAD assets in the RRIF using Norbert’s Gambit2. I chose XEQT over XGRO because the contribution of bonds in the portfolio was slightly over my asset allocation target3. XEQT is essentially XGRO, minus the bond holdings (it’s a 100% equity fund).

There was also a noticeable reduction in the contribution of ICSH to the portfolio; this was largely due to the unfavourable change in the USD/CAD exchange rate over the course of the month, and not due to any change in the holdings there.

Plan for the next month

The asset-class split looks like this

Overall retirement portfolio by market, April 2025

This looks to be pretty close to my target percentages which haven’t changed:

  • 5% cash or cash-like holdings like ICSH and ZMMK
  • 15% bonds (almost all are buried in XGRO and AOA)
  • 20% Canadian equity (mostly based on ETFs that mirror the S&P/TSX 60)
  • 36% US equity (dominated by ETFs that mirror the S&P 500, with a small sprinkling of Russell 2000)
  • 24% International equity (mostly, but not exclusively, developed markets)

So, the plan for next month is, do nothing out of the ordinary. Reinvest cash (dividends, TFSA contributions) in one of AOA, XEQT/XGRO, ICSH or ZMMK depending on the asset category most in need on the day of the reinvestment. All these ETFs are covered on my ETF All-Stars page.

Overall

My retirement savings declined 5.75% over the month (down 7% since January) due to the continuing meltdown in the equity markets. It’s not a pretty picture!

Net worth of retirement savings compared to start of retirement

This has not translated to a the same degree of change in my monthly salary. Why? My retirement payouts are calculated by Variable Percentage Withdrawal (VPW), which I cover here. VPW has a built-in cash cushion, which serves to dampen month to month swings in my net worth, either up or down. As you can see in the chart below, my monthly salary has stayed within a 1% band of the first salary I drew in January.

Month over month salary, as compared to start of retirement

  1. Since Questrade combines USD and CAD assets under the same account umbrella, I was able to reduce the number here. ↩︎
  2. I shift funds from the USD to the CAD side of the RRIF more or less quarterly since all RRIF payments are currently coming out of the CAD side of the portfolio. ↩︎
  3. That’s the optimistic point of view; it’s perhaps more accurately stated as “bonds haven’t melted down quite as much as the equity portion of my portfolio”. ↩︎

News: GlobalX TSX 60 ETF now at 0% MER

This just in!

GlobalX just announced that their Canadian Equity fund CNDX will rebate the management fee for the rest of the year. Up until now, I couldn’t recommend this ETF since prior to this news, its MER was a relatively stratospheric 0.13%1. But 0% is a MER I can live with!

They also have a bunch of their segment ETFs doing the same thing, but I don’t do segment bets. Just asset classes.

I don’t currently own any of this ETF.

  1. Compare Vanguard’s VCE or BlackRock XIC at 1/3 the price. Ok, not letter for letter the same thing, but c’mon… ↩︎