
You can think of this as the video version of https://moneyengineer.ca/2025/03/28/how-i-think-about-investing-asset-classes/.
Enjoy!

You can think of this as the video version of https://moneyengineer.ca/2025/03/28/how-i-think-about-investing-asset-classes/.
Enjoy!

If you adhere to asset-allocation strategies (as I do) then rebalancing your assets to reset them back to your targets is a way to make sure you stay on track1. Some people do this on a regular basis (monthly, quarterly, annually) but I try to do it whenever the drift becomes noticeable (more than 1% off of my targets2). The targets for my portfolio are
Given the week we’ve just had, it’s not really a surprise to see that I’m overweight in cash, and underweight in foreign equity. Some of my cash is untouchable because it’s the built-in cushion that Variable Percentage Withdrawal (VPW) requires3, so that’s out. The majority of the cash in play is found in my RRIF accounts, and most of that is found in USD.
So the problem to solve for is to find a low-cost International Equity ETF that sells on the US market. Let’s walk through the steps I go through for that.
Long time readers will know that most of my USD holdings are invested in AOA. (What’s the deal with AOA? Asked and answered here.) Since AOA is an all-in-one ETF, and since I know that AOA has international holdings (around 28%), and I know that AOA is inexpensive to hold, I can just do what AOA does, right?
So that is certainly a possibility, but as it turns out, AOA invests in TWO international ETFs, namely:
IDEV and IEMG are both excellent funds, but I don’t really want to buy two funds if I can help it. AOA holds these two in a roughly 3:1 ratio, and I am too lazy to keep that straight.
So time for plan B.
So I type “international ETF USD” into Google and see what I get.
The first hit is linking to etfdb.com which isn’t my favourite website. They always list 100 ETFs when I want to choose from maybe 4. So I skip that link.
Then I get a hit for IXUS, which is an iShares product. This one I’ve heard of, and it has a clever name (ex-US, get it?). On IXUS’ overview page, I see three promising factoids:
So that’s pretty good, but I want to look at least one more ETF to be a good comparison shopper.
A little bit further down I get a hit for VXUS, a Vanguard product. Like IXUS, it has a clever name (ex-US, get it?) and so I feel compelled to look closer.
And I see three factoids again:
And so, with that, the decision is made: we go with VXUS because it’s 0.02% cheaper than IXUS.
This will be new ground for me, because it will be using my new provider for the first time (Questrade). My old provider let me sell one ETF and immediately buy another, and I assume that Questrade will also allow this, but until I try it, I’ve learned not to assume things.
Oh, yes, the “cash” in my USD RRIF is actually also an ETF, namely ICSH, which is because Questrade doesn’t provide any other means to earn money on “cash”.
So anyway, on Monday, a few hours after the stock market opens, I’ll take a look and see if trading is still a advisable — has the market suddenly recovered? Is it so volatile it warrants sitting on the sidelines? I’m guessing both of those will be a solid “no”, but I will wait until Monday to follow through.
I signed in yesterday to my brokerage account around lunchtime so I missed all the morning’s excitement. After everything I wrote above, I didn’t buy VXUS after all — since my US equity portion was also significantly below target, I bought AOA instead, thus increasing both my US and International equity positions at the same time. I used a limit order since the bid/ask spread was like 20 cents, far higher than I’m used to seeing.
When markets are this nutty, I don’t like making all purchases at once. Since Questrade trading of ETFs is now totally free, I can take my time and incrementally shift the portfolio back to targets.

Early on when I first launched this blog, one of my friends suggested that video content would be ideal for the topics I wanted to cover. “I’m a visual learner” was her pitch1. I did hesitate because I wasn’t sure what I would post there.
But the hesitation is over, and I’ve launched a YouTube channel which you can find in the top menu (“Videos”) or you can go to it directly: https://www.youtube.com/@MoneyEngineerCA.
The first video2 is a quick intro to the Multi-Asset Tracker, a Google Sheets template that’s based on my personal spreadsheet that I’ve developed over the years.
Today’s video is a quick look at BlackRock’s family of asset-allocation ETFs (XEQT, XGRO, XBAL, XCNS and XINC) and what makes the members of the family different.
My philosophy is to keep the videos short with no window dressing. There’s no big intro, no sponsor plugs3, no big plea to “Like and Subscribe”, and no theme music. We get going right from the opening frame. I reserve the right to jazz things up later, but with 2 views thus far I’m not too worried about going viral anytime soon.
If you have thoughts/comments/ideas about the videos, feel free to drop me a line at comments@moneyengineer.ca.

Summary: High Interest Savings Accounts (HISAs) are a way for cash to earn half-decent, risk-free interest. These “Series F” HISAs are likely available through your online broker, but you may have to ask how to get at them, exactly.
We talked about HISAs in February over here if you need a quick reminder: https://moneyengineer.ca/2025/02/14/earn-money-with-your-cash-the-hisa-table-february-2025/
On March 12, the Bank of Canada reduced their overnight rates by another 0.25%.1 Unsurprisingly, this had a knock-on effect to the interest rates provided by the series F HISAs I track.
Equally unsurprisingly is that the US Federal Reserve didn’t touch their rates, and as a result, there were no changes in the HISA rates paid out for USD accounts. Here’s the full breakdown:
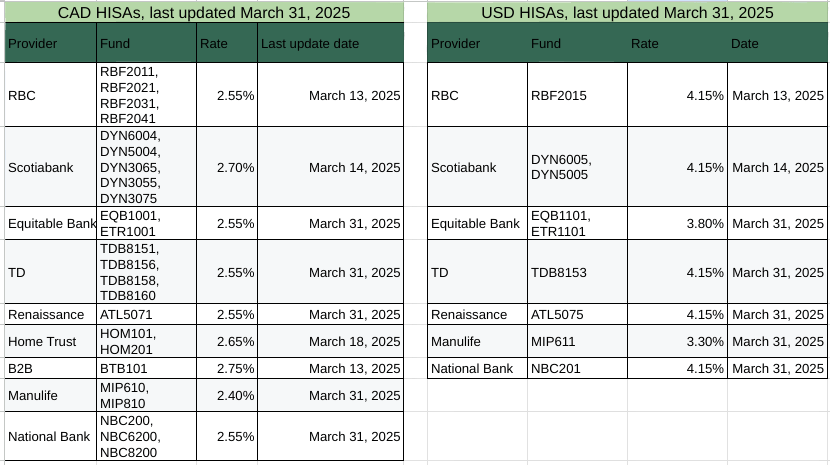
There’s also a Google Sheets version with a bit more detail (source links) if you prefer.
For Canadian Dollar HISAs, B2B bank remains top of the heap: https://b2bbank.com/advisor-broker-rates/banking-rates.
For those of you who hold US cash in your brokerage accounts, you can benefit from the much higher US interest rates, and you have multiple choices since multiple providers are paying the same rate.
Passive investing while ensuring good diversification has been my strategy for decades. But how do I define “diversification”? For me, it’s always been about paying attention to how much of my total portfolio was invested in each of five1 asset classes and keeping them aligned with my targets:
I got this idea from my last financial advisor who provided me with a lovely Cerlox4 bound annual report showing me how hard they were working on my behalf5. The report included a pie chart of how my investments broke down. This is what that pie chart looks like in my portfolio this morning:
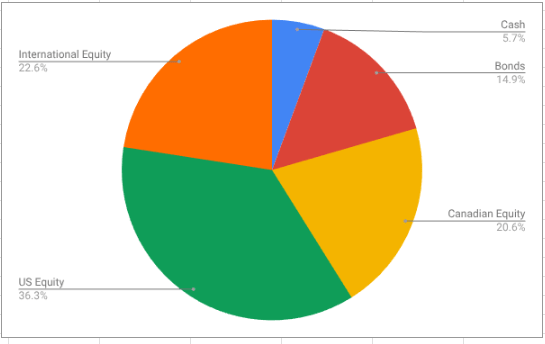
This pie chart has been my guiding principle: have a target percentage for each asset class in mind, and adjust your portfolio as needed to keep the percentages in line. This simple principle has been adopted by so-called asset allocation ETFs aka “all-in-ones” like (my personal favourites) XGRO6 and AOA7.
But are these even the right asset classes? Where are REITs8? Where’s precious metals? Where’s Bitcoin9? What’s your bond duration? Do you have enough exposure to high-growth geographies?
Short answer: just like I’m too lazy to pick stocks, I’m too lazy (and not smart enough) to pick a “winner” of a given asset class. The “periodic table” of investment returns by asset class is a must-read for DIY enthusiasts out there: https://themeasureofaplan.com/investment-returns-by-asset-class/ (go ahead, take a look, I’ll wait).
The folks at Measure of a Plan agree that trying to figure out the “hot” asset class is a very difficult task:
It’s no easy feat to pick the winner in a given year. The asset class rankings appear to be randomly tossed about over time, with the top performer in one year often falling down to the middle or bottom of the table in the next year.
https://themeasureofaplan.com/investment-returns-by-asset-class/
By keeping an eye on the pie chart, and shifting investments to align with my targets, I’m never at risk at being overweight in any one asset-class, and beaten-down asset-classes naturally get more funds to get the percentages right. It’s naturally causing “buy low, sell high” behaviour.
So: what about the asset classes I’m using? Are 5 asset classes too many? Too few? I don’t know. “Good enough” is sort of my philosophy in the spirit of trying to keep things simple.
The spreadsheet I’ve used to help me track my portfolio breakdown is found here. In future posts, I’ll talk a bit about how to make it work for you.
