A recent newsletter (On Money) from the Globe and Mail caught my attention. In it, the author (David Berman) made the assertion that ZEB (a BMO ETF that invests solely in the Big 61 Canadian banks) was a better way of investing in the Canadian banking segment over holding the stocks individually. Two of the big reasons align very well with my own philosophy, namely:
The ETF fees include regular rebalancing
The ETF removes the temptation to time the market
These are the main reasons the majority of my retirement savings are in all-in-one ETFs like AOA and XGRO.
But anyway, what caught my eye about the article were the eye-popping returns of this segment, especially compared to the overall TSX, captured in an ETF like XIC. So I did a quick analysis which I share with you here:
In summary,
Canadian banks make up about 1/3 of the Canadian stock market (and hence XIC)
This segment has outperformed the overall Canadian market — by a wide margin — over the past 16 years
Past performance does not guarantee future results
This analysis hasn’t changed my perspective; I still prefer diversification over raw performance…no FOMO for me.
TD, CIBC, Bank of Nova Scotia, RBC, BMO, National Bank ↩︎
Eight times a year, the Bank of Canada and the US Federal Reserve have meetings to set and announce their key interest rates. In what I’m sure is a total coincidence, they often happen on the same day. Per the Bank of Canada and the US Fed, here are the dates for 2026:
Wednesday, January 28
Wednesday, March 18
Wednesday, April 29
Wednesday, June 10 / June 17th for the Fed
Wednesday, July 15 / July 28th for the Fed
Wednesday, September 2 / September 15th for the Fed
Wednesday, October 28
Wednesday, December 9
Normally I don’t really pay too much attention to financial headlines. But since interest rates have a direct impact on the monthly income I can expect from the cash holdings in my portfolio (and by “cash” I mean ultra short-term bond funds1), and since I try to keep my HISA and short-term bond table (Canada & US) accurate, I do pay attention to that particular piece of market intel.
ZMMK in CAD, ICSH in USD, both members of the ETF All-Stars club ↩︎
And here you see why most of my “cash” is in ICSH instead of ZMMK. US interest rates are higher in Canada, and although there is of course foreign exchange risk involved, I’m ok with that. ↩︎
This is a monthly look at what’s in my retirement portfolio. The original post is here.
Portfolio Construction
The retirement portfolio is spread across a bunch of accounts:
6 RRIF accounts
3 for me (Questrade, QTrade, Wealthsimple)
3 for my spouse (Questrade, QTrade)
2 TFSA accounts (Questrade)
4 non-registered accounts, (1 for me, 1 for my spouse, 2 joint, all at Questrade)
The view post-payday
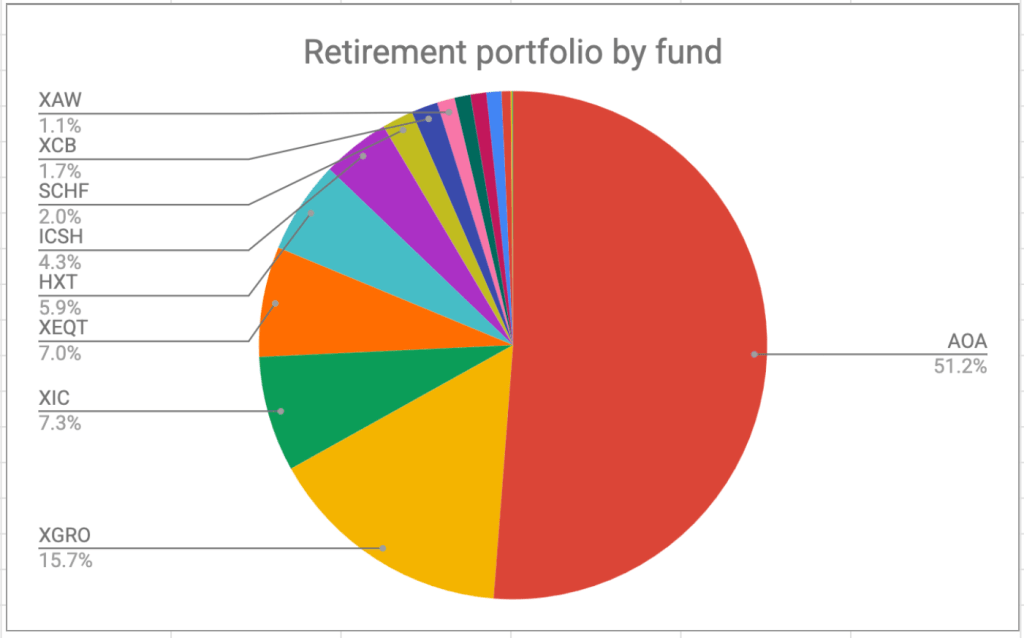
I pay myself monthly in retirement, so that’s a good trigger to update this post. On January 26, this is what it looks like:
The portfolio is dominated by my ETF all-stars, but if you’ve been following along, you’ll see a few changes.
As mentioned in a previous post, I did some shifting around and you now see XAW and XIC increasing their contribution to the portfolio at the expense of XGRO.
I also tidied up some extra funds that aren’t needed — VCN was replaced with XIC1, and I turfed some small holdings.
I sold more HXT than I needed to for my monthly paycheque, and when I discovered the mistake2, I just bought XIC instead.
And, I did my quarterly Norbert’s Gambit to shift some AOA to XGRO. And again, I came out ahead!
Plan for the next month
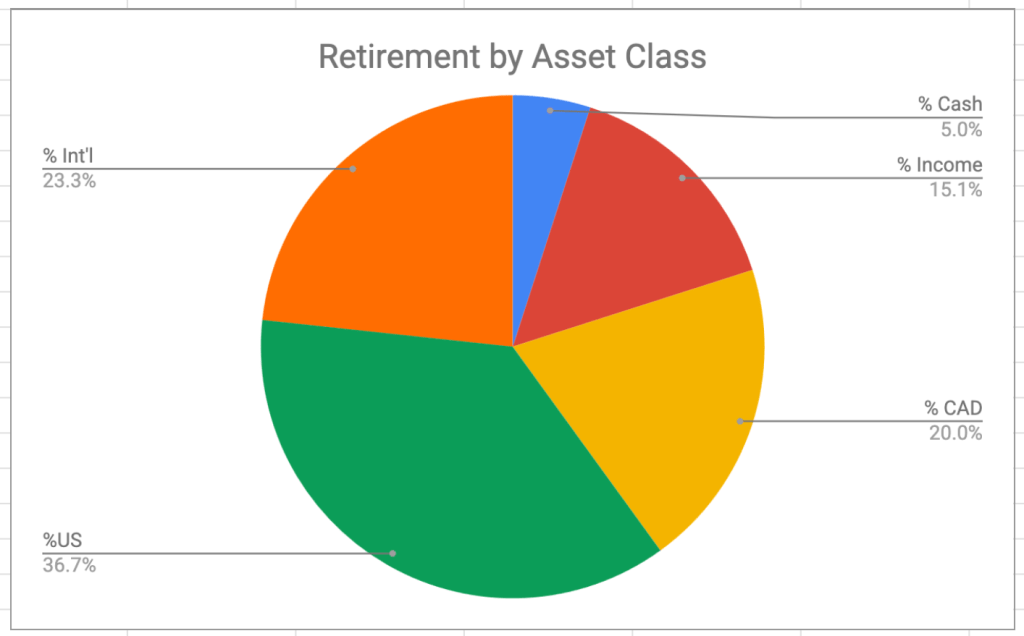
The asset-class split looks like this; you can read about my asset-allocation approach to investing over here.
It’s looking pretty close to the targets I have, which are unchanged:
5% cash or cash-like holdings like ICSH and ZMMK
15% bonds (most are buried in XGRO and AOA, some are in XCB)
20% Canadian equity (mostly based on ETFs that mirror the S&P/TSX)
36% US equity (dominated by ETFs that mirror the S&P 500)
24% International equity (mostly, but not exclusively, developed markets)
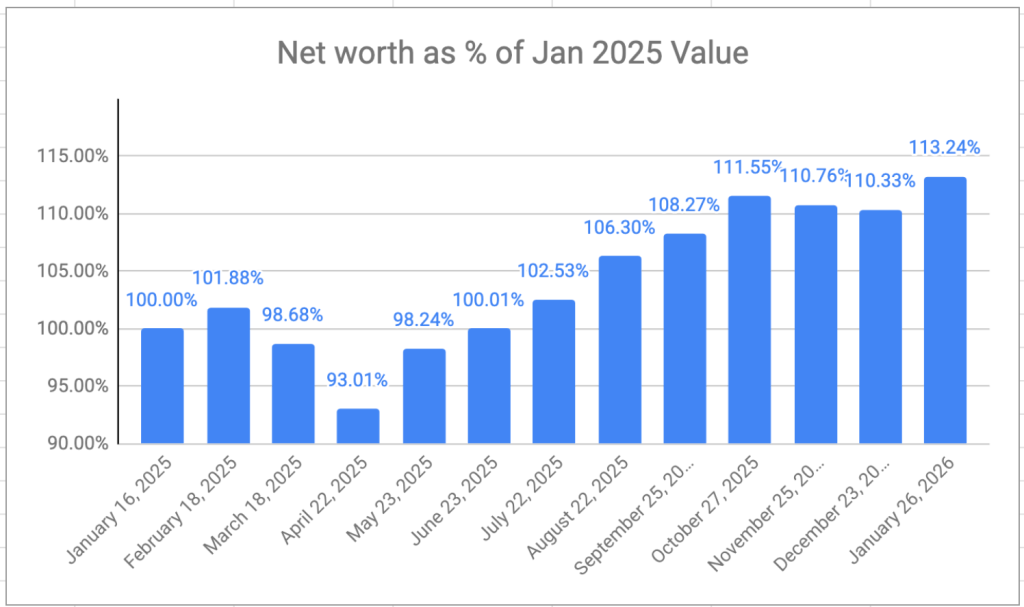
Overall
Net worth overall is up month over month, reversing a 2 month losing streak and hitting a new all-time-high:
I had to do some quick manual calculations because I had already updated my auto-calculating spreadsheet to reflect fewer RRIF accounts. My RRIF transfers are 2 months in progress and counting. I guess trying to move a RRIF near the end of the year was a bad idea. ↩︎
My retirement portfolio is spread across multiple brokers and multiple accounts. And although I treat the portfolio as a unified entity when it comes to asset allocation (the concept is discussed here), different accounts have different allocations. The reasons are varied, but I would rank inertia as one of the big contributors — sticking with what’s there seems like a lot less effort than the other options.
What I think in important to point out is that the portfolio is still dealing with inflows and outflows every single month:
I pay myself RRIF minimum from my RRIF accounts, and this usually means selling some shares of XGRO
If RRIF minimum isn’t sufficient for my expenses (and it hasn’t been), then I have to liquidate shares from my non-registered account.
I contribute to our TFSAs every month
Questrade gives me free money every month as a reward for shifting assets their way (see how I did it here). This money shows up in my non-registered accounts1.
Dividends show up every month2; every quarter there is an even bigger distribution
And quarterly I convert some of my AOA holdings to XGRO within my RRIF using Norbert’s Gambit3. When I do this, it reduces my US and international equity holdings and replaces it with Canadian equity4.
So given all these ins and outs, there are always opportunities to tweak the asset allocations so that they remain close to my targets.
But this study did make me realize that the small allocation I had of bonds in my TFSA was wrong-headed. Since in my planning the TFSA is the LAST place I’ll head to fund my retirement, it follows that it should have the longest-timeline investments. So, for me, that means 100% equity is the correct allocation for the TFSA accounts. So what did I do?
I sold the bonds in my TFSA (XSH was the ETF), and put them in my RRIF (choosing instead to use XCB, a longer-duration corporate bond fund)
Of course, since you can’t add money to a RRIF, something had to be sold there. XGRO was plentiful, so that’s how I funded the bond purchase. From an asset allocation perspective, selling XGRO meant that I reduced my Canadian, International and US Equity exposure at the same time.
To compensate, the cash I generated in my TFSA by selling XSH was used to buy a combination of XIC (Canadian Equity) and XAW (US and International equity combined). XIC was already in the TFSA6. XAW is new but gives back the US Equity and International Equity I lost by selling XGRO7.
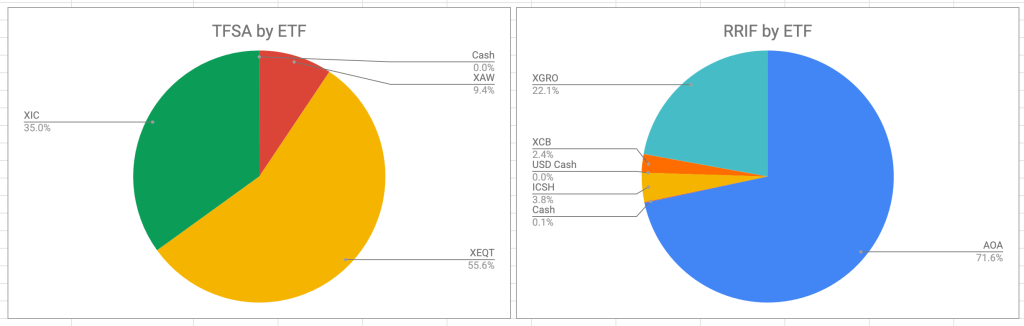
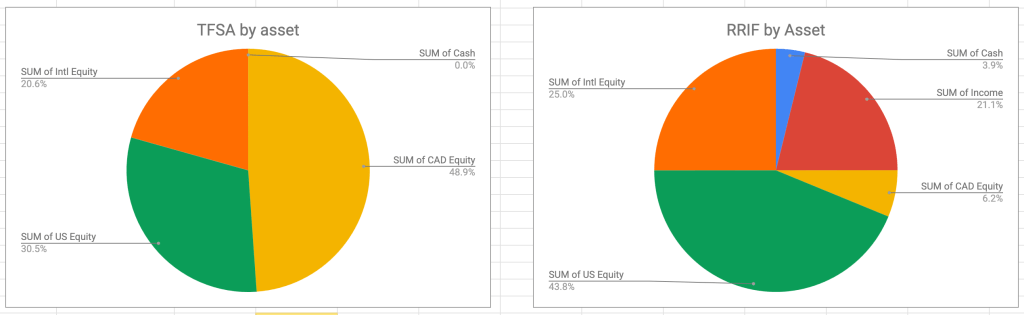
This is how the two accounts break down now, both from an ETF and an asset-allocation perspective. (In the asset allocation charts “Income” is the nomenclature I use for “bonds” and “Cash” means actual money as well as ultra-short-term bond funds like ICSH and ZMMK).
The result is my TFSA is now 100% equity, and the lower-growth cash-generating bonds are now all in my RRIF accounts. More efficient all around!
Leaving the free money as part of the retirement portfolio was a conscious decision. I could have just as easily decided to withdraw the money every month. ↩︎
Both ZMMK and ICSH pay monthly. They are both featured in my ETF all-stars. ↩︎
AOA is 50% US equity, 28% International equity. XGRO is 36% US Equity, 24% International Equity. ↩︎
It’s not a straightforward topic. In the end, the foreign withholding tax isn’t huge but as a cheapskate, it’s noticeable and can be higher than MERs of the ETFs you hold. ↩︎
XIC helps tilt the overall Canadian equity allocations in the right direction. AOA tilts it in the wrong direction. ↩︎
The current numbers don’t allow me to use an XEQT/XIC combination. Over time, this will change. ↩︎
I got wind of ZGRO.T through Reddit, specifically r/CanadianInvestor. ZGRO and ZGRO.T are both all-in-one asset allocation ETFs from BMO, but with vastly different yield characteristics. I was confused, but in the end, decided that ZGRO.T was probably not a bad pick for use in a RRIF account as it might save you the hassle of selling shares. Their TOTAL returns (assuming all dividends are invested) are effectively identical.
4th-ranked post of 2025: Spousal RRIF Attribution Rules
I think I was first warned about this nuance of spousal RRSPs/RRIFs by my DIY neighbour (thanks, Steve) and is the main reason I’m only drawing RRIF minimum for the next two years1. I think most of the visits to this article were search-driven. Either that, or people came to admire what might be my favourite article thumbnail2 I’ve posted thus far.
3rd-ranked post of 2025: Norbert’s Gambit with Questrade
As someone who holds more USD-denominated assets than might be wise, I do very much appreciate the existence of a cheapskate way of converting between USD and CAD assets. I think I first learned about this trick via The Loonie Doctor’s blog. The #3 blog entry explains how it works if Questrade is your broker. I would also recommend https://moneyengineer.ca/2025/08/21/tracking-norberts-gambit-costs-with-questrade/ for a very clear picture of what it actually costs (in time and fees) to execute the Gambit: in three of four instances, the time delay of executing the gambit has worked in my favor as the FX rate has drifted a bit to my advantage.
2nd-ranked post of 2025: TD versus iShares all-in-ones
I’m a fan of all-in-ones (and am a little sad https://moneyengineer.ca/2025/01/21/why-you-can-fire-your-advisor-asset-allocation-etfs/ didn’t crack the top five last year). I am genuinely puzzled why people seem to get so wound up about which family of all-in-ones to choose3. I examined TD’s only because their cost to own is a bit cheaper than iShares (who I use primarily), and I’m a cheapskate. (I studied the cost of owning an all-in-one here.) Anyway, in the end, the biggest difference is visible in TGRO versus XGRO because TGRO, unlike any other GRO ETF, uses 10% bond allocation and not 20%. This gooses its return a bit, at the cost of additional volatility. Otherwise, it’s a case of tomato/tomahto. Pick one, or pick them all, it doesn’t matter much.
This was, as the title implied, a quick review of a made-in-Canada tool to help craft a retirement plan. And again, my DIY neighbour gave me a heads-up about it4. It got a lot of interest, probably because the kind folks at Optiml linked to my review from their website ;-). I was impressed by the completeness of the tool during my test drive, and it seems like a good and fairly priced way for a DIYer to do some validation of their retirement plan. Having validation of my plan was one of the ways I knew I could retire.
Looking forward to seeing what the 2026 list might look like! Got a topic or question? Send it along to comments@moneyengineer.ca, or comment below!
RRIF minimum withdrawals are never subject to spousal attribution ↩︎