I try to stay informed about the options out there for the DIY investor. Reddit has a lot of decent groups that help me stay in the know. Here’s a few I follow. And sometimes contribute to1.
r/Questrade
The Questrade subreddit is a good place to hear about changes on the platform. Questrade is currently my provider of choice since they are currently paying me to use their platform. Questrade employees do pay attention to this sub and will sometimes personally reach out to help (I’ve had this happen to me).
r/Wealthsimple
I have a growing relationship with Wealthsimple. I have one RRIF account with them (history of why is found here), their Cash card is a wonderful tool to save money when traveling and their chequing accounts actually pay reasonable interest rates. Lots to like. Their platform is ever evolving and the folks on the Wealthsimple sub help me to keep an eye on what’s coming up. I’m a fan of this product, and would consider using them as my primary financial services provider, once they have all the pieces I need in place. (Current shortfalls: USD support is weak, no spousal RRIF accounts last time I checked).
r/Bogleheads
No, not that kind. “Bogleheads” are folks that are disciples of Jack Bogle, credited for creating the first ever passive index fund. Bogleheads, like me, are passive index investors. The posts on the Boglehead subreddit are comprised of primarily US investors, but the concepts they talk about are applicable to the Canadian investor. My own investment philosophy is, as it turns out, strongly aligned with that of the Boglehead crew.
r/JustBuyXEQT
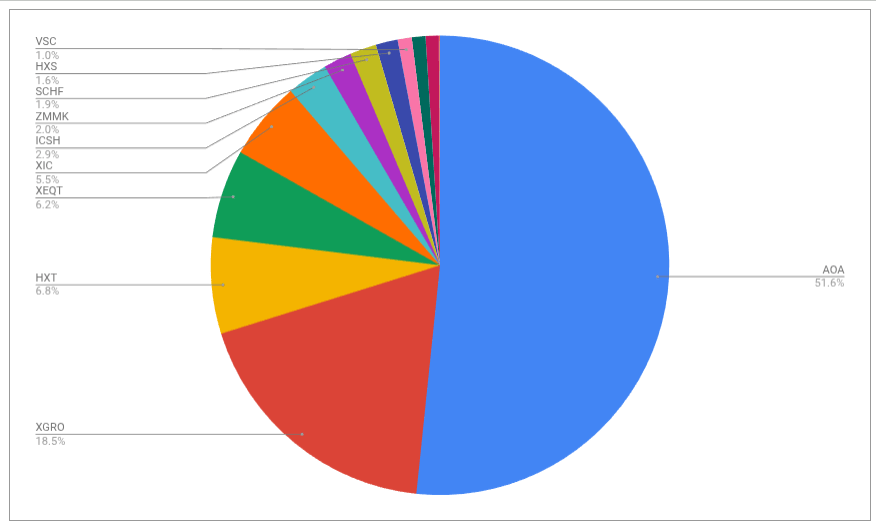
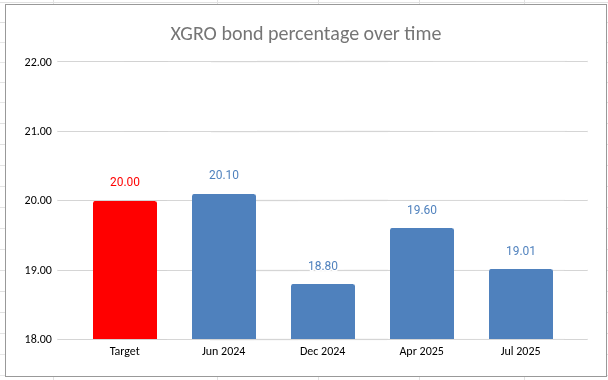
This sub’s biases are pretty plain to see. It’s populated by uber-fans of the all-equity all-in-one that I hold in my own portfolio,2 although not exclusively. (I prefer XGRO as it provides a bit of downside protection, but my thinking may be flawed on that front). XEQT is on my all-stars list. Posts are generally from younger investors who are looking for an easy way to invest and forget. Given my recent analysis, I’ll probably start buying into TEQT to save a few dollars on the MER front.
r/CanadianInvestor
This sub is more generally about investing in the Canadian market, and in some ways serves as a counter to the other subs that are more closely aligned with my couch potato style of investing. Unlike the other subs, I lack sufficient karma3 to contribute…I’m very close though.
r/cantax
This sub is all about the Canadian tax system. I sometimes pick up good tips this way.
Are there Reddit groups you think this community should know about? Let me know at comments@moneyengineer.ca!