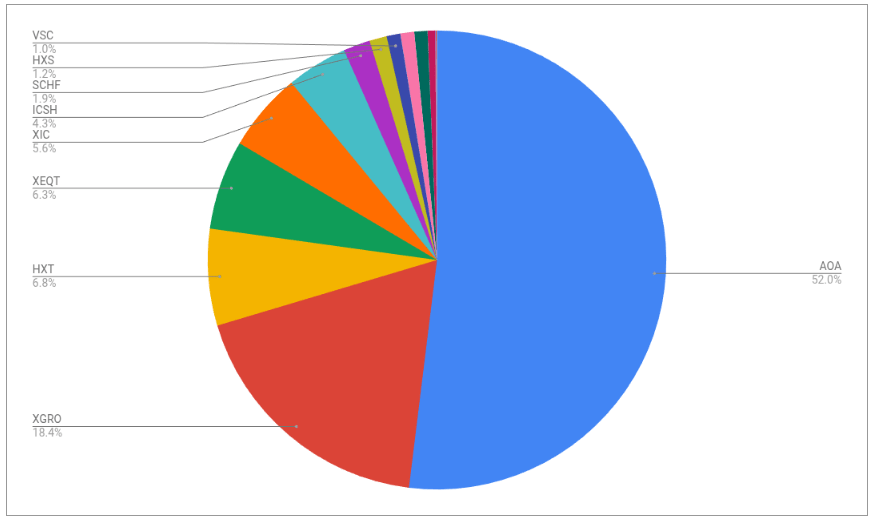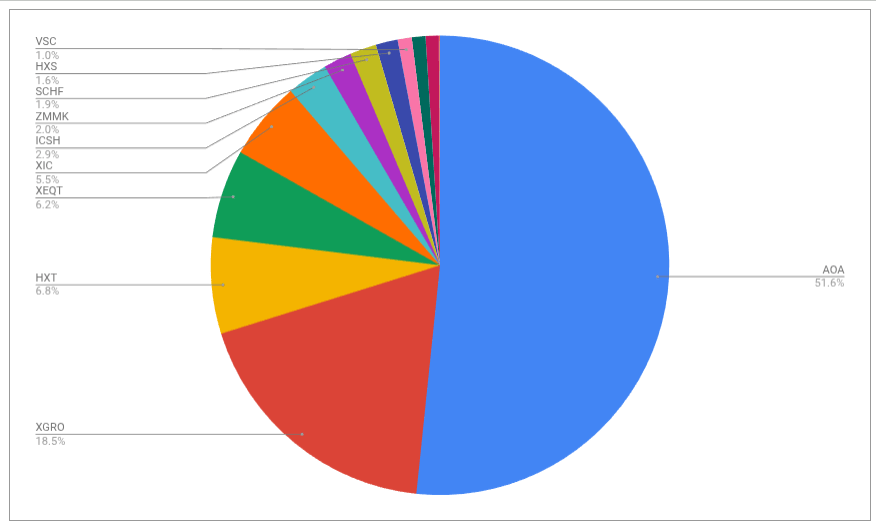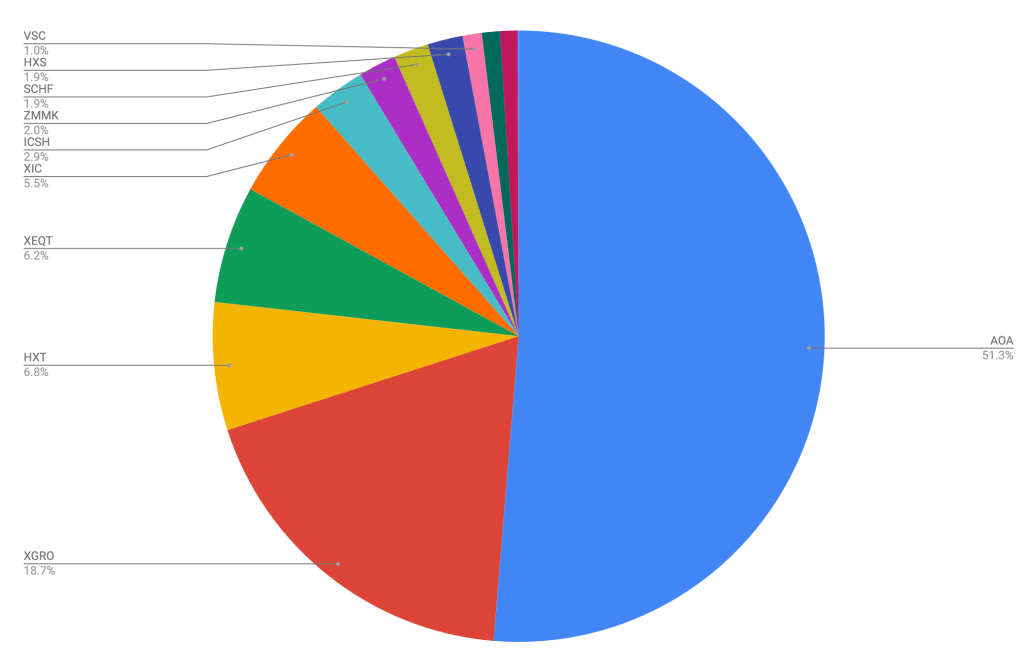
As a dedicated low-fee ETF investor (new to ETFs? read more here), most of my holdings are actually tied up in various index funds; as of right now about 26% of my retirement savings are tied up in the S&P 5001 (largely by holding AOA and XGRO, two of my ETF all-stars), and another 11% are tied up in the S&P/TSX capped composite2 (a lot of which is due to holding XGRO)3.
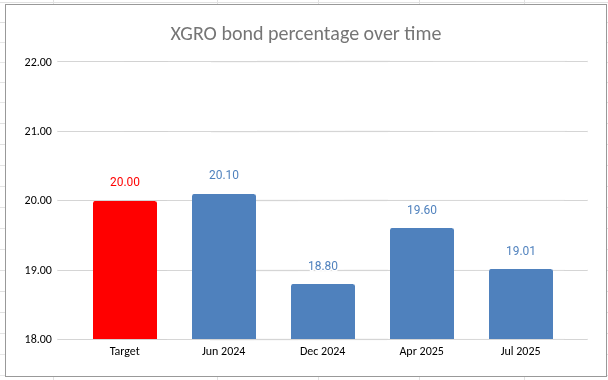
Beyond making sure I keep my asset allocations in line (read more about that concept here), there’s not much to do. But this doesn’t mean that what I ultimately hold isn’t always changing!
I was reminded of that fact when I noted the latest announcements from S&P, who on a quarterly basis, rejig their indices to add new stocks and drop others. It’s not something I’ve typically paid any attention to, but I share it with you because I found it interesting.
S&P 500: AppLovin, Robinhood & Emcor added, MarketAxxess, Caesars and Enphase deleted
Effective, September 22, 2025 per the press release.
Newly added: AppLovin seems to deal in the world of online advertising, Robinhood is a notorious4 online broker, and Emcor looks to be a construction company.
Newly booted: Marketaxess sells a platform to financial services companies, Caesars operates casinos, and Enphase is a solar energy product company5.
S&P/TSX Composite6: 5 added, 2 deleted
Effective September 22, 2025 per the press release.
Newly added: Aris, Discovery, Perpetua and Skeena who are all involved with precious metals production7 and Curaleaf which is a weed dispenser.
Newly deleted: Enghouse (software and services, based in Markham) and Pason (products and services for oil and gas based in Calgary).
If ever you want to see what’s in either of these indicies, then check out this chart for the S&P 500 and this chart for the TSX composite.
- You can read about this index right from the source if you like. ↩︎
- There’s another 6% in the S&P/TSX60 index, which are the 60 largest Canadian firms. The 10 year return of these two indicies is nearly identical — 7.98% for the capped, 8.06% for the TSX 60. You can read about the capped composite here. ↩︎
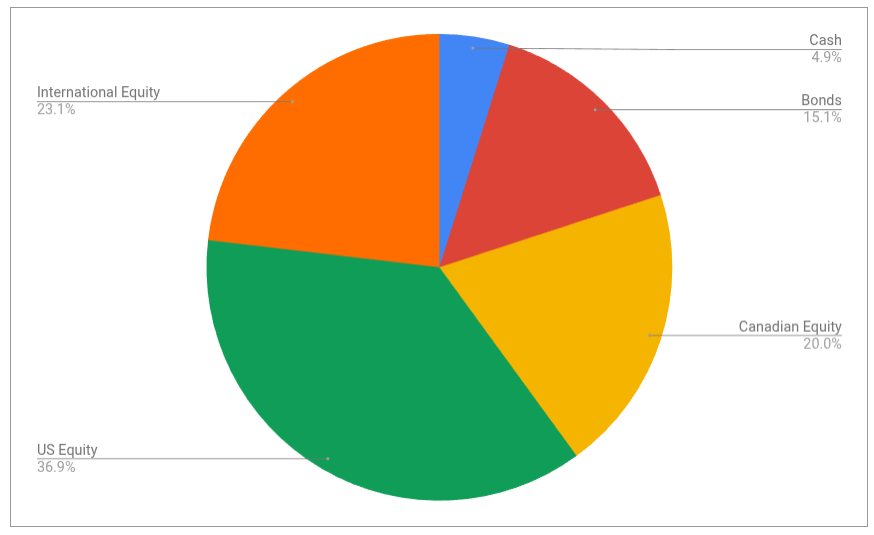
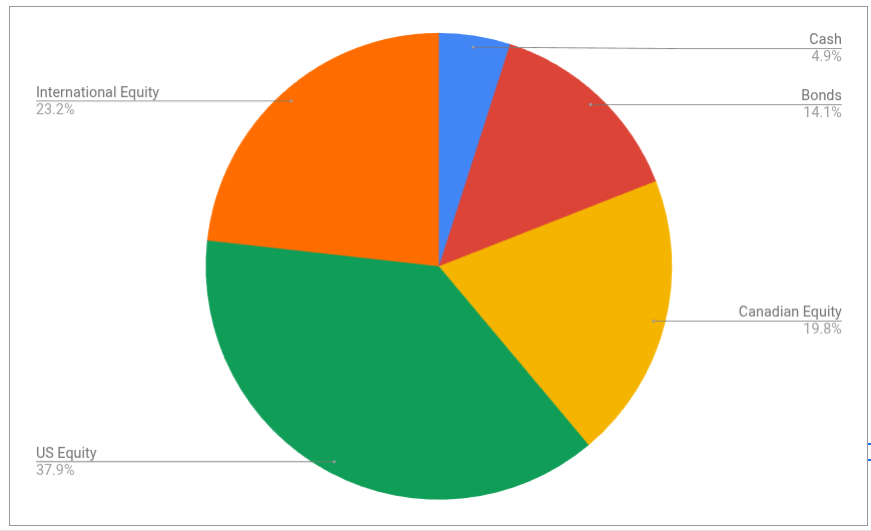
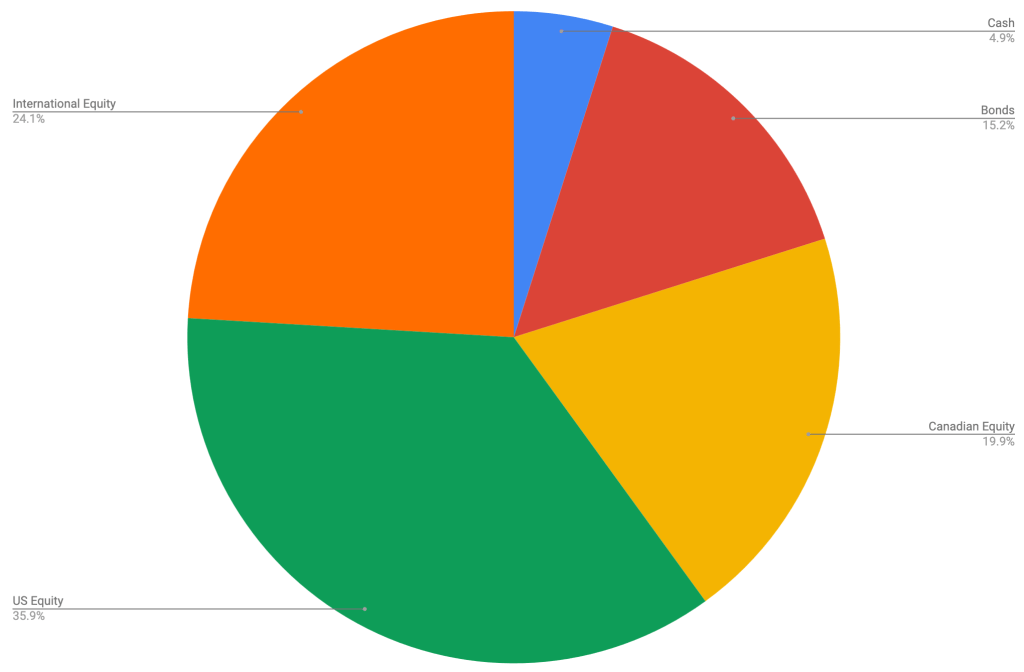
- You may wonder where the rest of holdings are. There’s 15% in various bond indices, 5% in cash, and the rest are in an assortment of international indices (largest are MSCI World ex-US at 10% and MSCI EAFE IMI at around 5%) and lesser-known US/Canadian indicies (like FTSE all-cap Canada or S&P total market US). In the Canada/US case, I’m rather certain that an all-cap index has a very high correlation with the large-cap indices; I could have bundled it all together I suppose. ↩︎
- Notorious because they are associated with meme stocks. ↩︎
- It’s probably not a good time for any US company in the renewables business, sadly. ↩︎
- I wondered when the last change to the TSX 60 was. I couldn’t find one after September 2019! ↩︎
- Perhaps a “why I don’t need to buy gold bars from Costco” comment is apropos here ↩︎