My retirement fund is divided amongst a bunch of different accounts: RRIFs, TFSAs, non-registered. And although I present them as a monolith in my monthly updates (latest one here), I don’t treat them the same way and they have rather different things inside them.
I don’t claim to have a fully optimized portfolio; a thoughtful reader was asking me questions about tax implications of my current holdings, and I admittedly haven’t given a ton of thought to that. But I will in a future post 🙂 .
So, in other words, you’re getting my current thinking for what I hold where. It may not be ideal. But at least you see why things are the way they are.
Below you can see how my retirement funds are divided amongst my various investment vehicles. This one is accurate as of January 8, 2026, and is greatly facilitated by tracking my stuff in Google Sheets. There’s a basic template of what I use over here1.
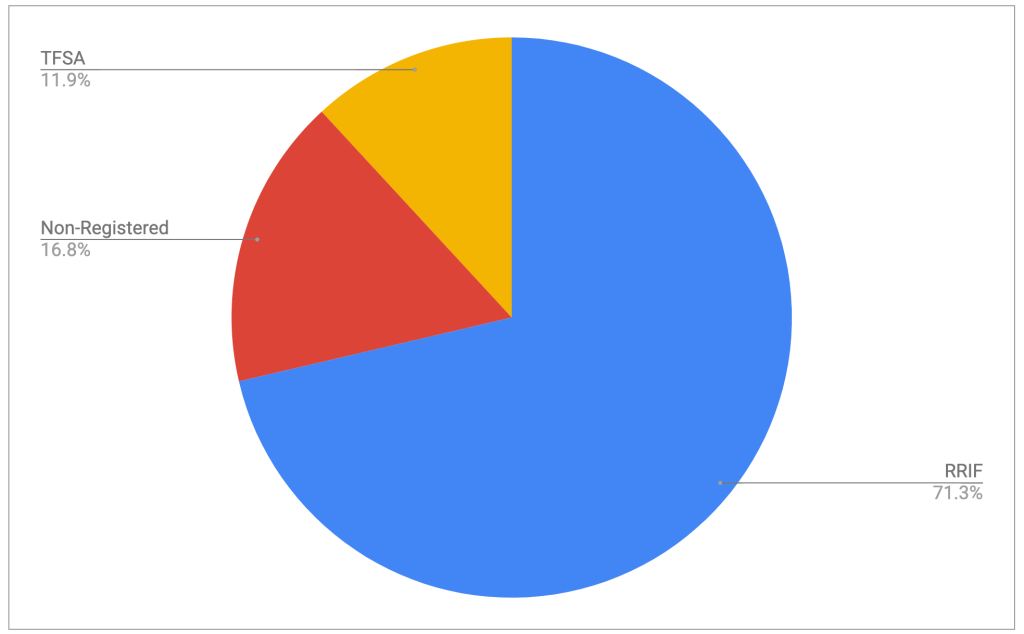
So that’s where it’s at. How do I treat the three main segments of the pie?
RRIF
So the RRIF is clearly the largest piece of the retirement pie and will be around for some time, possibly for the rest of my life. At this point in time, I’m only taking RRIF minimum payments which are recalculated every year and are based on my age and the value of my RRIF on December 31 of the previous year.
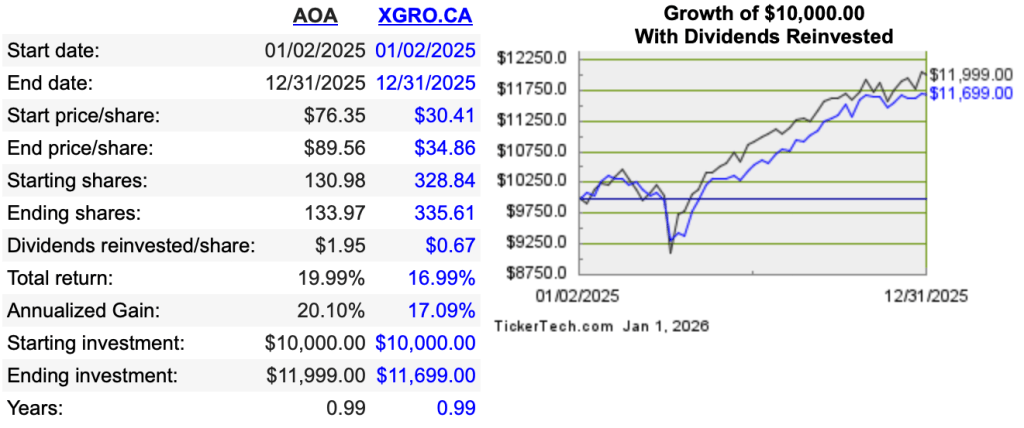
I am taking RRIF minimum primarily because I want to avoid the hassle of spousal RRSP/RRIF attribution that I talk about here. RRIF minimum is quite a bit less than the expected return of this account given the holdings therein, mostly AOA and XGRO:
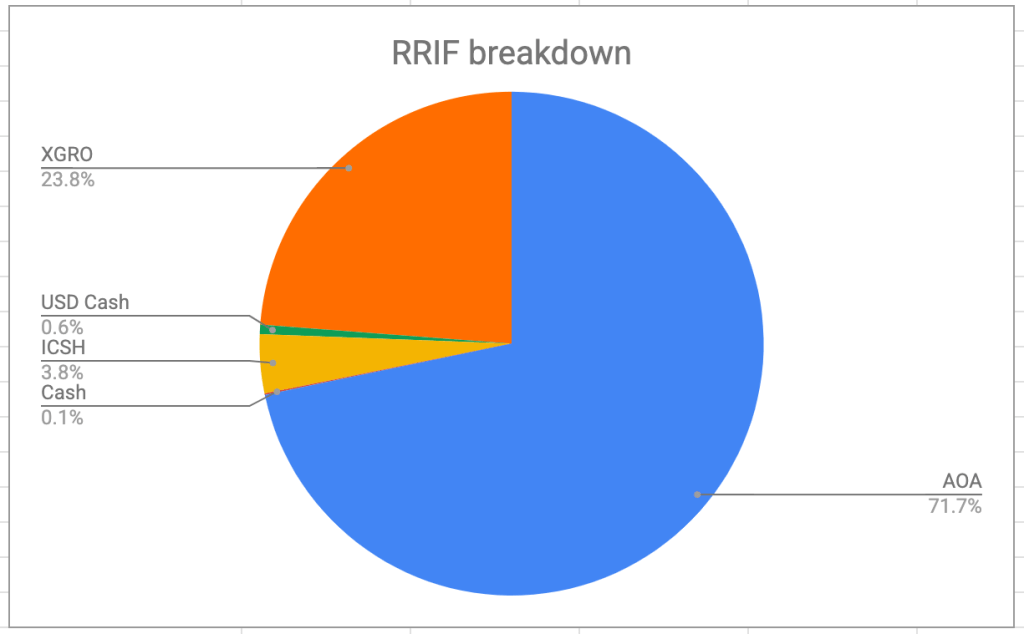
I periodically (once a quarter) shift funds from AOA to XGRO using Norbert’s Gambit2. How much? Well, at the beginning of the year, I see how much of my RRIF is in USD. I then multiply that by my RRIF age factor3, divide by four, and presto, I have a quarterly amount I should move.
All of my many RRIF accounts4 have XGRO, and on the day I make my payday calculations, I have a spreadsheet that calculates how many shares of XGRO I need to sell in each account given the current price of XGRO and the amount of CAD happens to be kicking around in a given account. In very rare circumstances, I might (as well/instead) sell AOA if I had a need for US cash5.
The small contribution of ICSH here is because I have a 5% “cash” asset allocation in my portfolio, and I needed someplace to keep this monthly income. RRIF seems as good a place as any, especially since all those monthly dividends are completely tax-free as a result.
In the coming years, the RRIF will take on more and more of my monthly spending needs. Once the attribution time period has lapsed, I’ll probably take more than RRIF minimum from here in an effort to reduce taxes for older me — once I start collecting CPP/OAS as well as RRIF payments, I could find myself in a taxation world of hurt. Making my RRIF smaller will help, but there is no free lunch. You either pay taxes while you’re alive, or your estate will pay them when you’re not.
Non-Registered Accounts
I really have two kinds of non-registered accounts in my retirement calculations, and they have very distinct usages. Let’s see the difference:
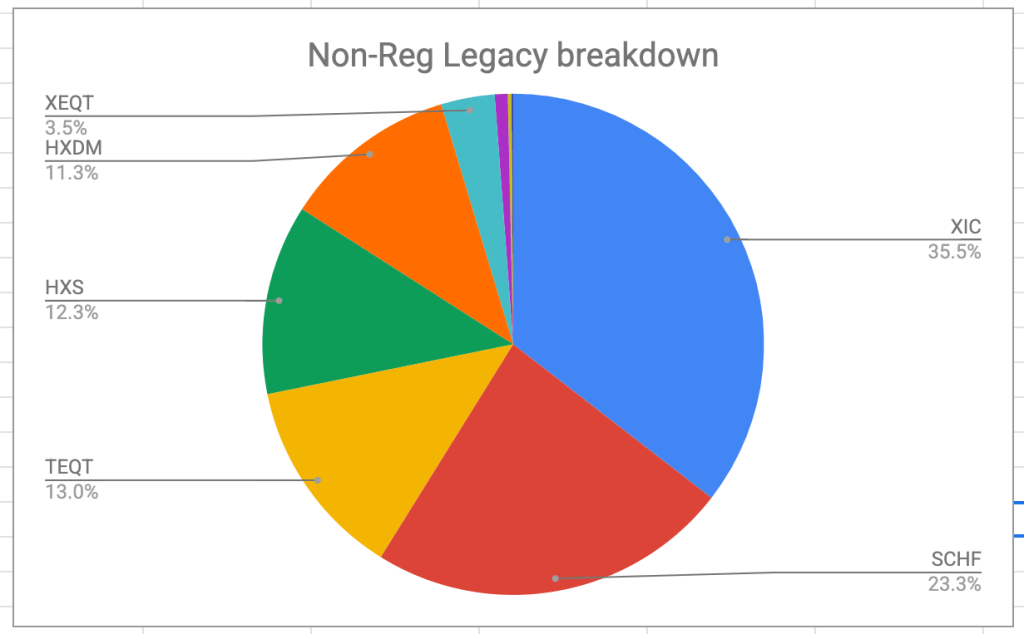
The “legacy” non-registered accounts are long-standing accounts that have grown over the years of accumulation. They are held in my name and my spouse’s name and taxed accordingly. These accounts, specifically the one in my name, account for probably 2/3 of my current income. Every time I withdraw from these accounts, I have to account for capital gains, which is fine, since the taxation treatment of capital gains is generous. You’ll also notice that this account is 100% equity. And as previously noted, the dividends thrown off these investments is not particularly noteworthy (not zero, but nothing a dividend-focused investor would get excited about). That’s why you see funds like HXDM and HXS here, to explicitly avoid dividends. This portion of my non-registered funds is targeted to eventually go to zero in the next few years, probably before I start collecting CPP. That’s a tax avoidance strategy, no idea if it will work out in my favour.
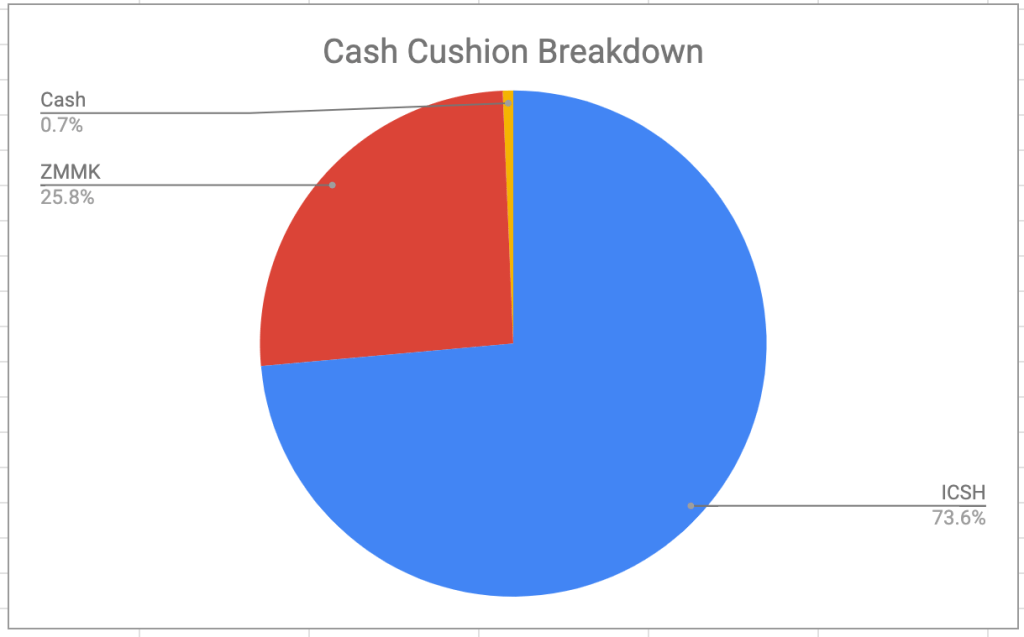
The “cash cushion” non-registered holdings are 100% in ultra-short term bond funds, which to my way of thinking, is equivalent to cash. This account exists because I use VPW as a decumulation strategy, and the cash cushion helps smooth out my monthly salary. Sometimes I add to the cash cushion (directly from my other non-registered account) and sometimes I pay myself from the cash cushion. You can read all about how it works at The Mechanics of Getting Paid in Retirement. Here I keep a bit of uninvested cash floating around in an effort to reduce the number of buys/sells I have to do here. The capital gains are quite minimal in these funds since both ICSH and ZMMK stay close to $50/share6 but it’s possible to make minor gains/losses7 depending on the exchange rate and day of month I make the purchase/sale.
TFSA
The TFSA, per the plan prepared for me by my fee-based advisor, (part of the steps I took to figure out that I had enough to retire) is the last account to decumulate. I continue to contribute to my TFSA monthly, like I have ever since TFSAs were a thing. That would be an “expense” I could cut if needed, I suppose. It tilts heavily towards equities8:
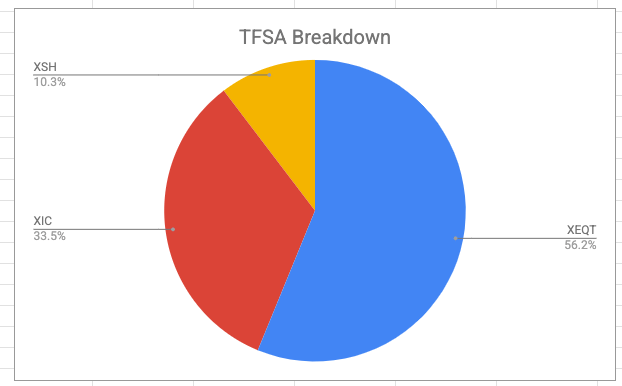
Besides XEQT, you currently see XSH, a bond fund9. This exists in order to keep my target asset allocations in line, and because I don’t really want the monthly distributions landing in a taxable account. Perhaps that holding would be better in my RRIF? There’s also XIC here, which is a Canadian equity fund, necessary to offset the heavy US equity contribution made by AOA.
- Over the holidays I’ve started on a new template that makes heavy use of pivot tables, which I do like quite a bit. ↩︎
- You can track my progress over at Tracking Norbert’s Gambit Costs with Questrade ↩︎
- Per https://www.canada.ca/en/revenue-agency/services/tax/businesses/topics/completing-slips-summaries/t4rsp-t4rif-information-returns/payments/chart-prescribed-factors.html, it’s “1 divided by (90 minus my age)” until I turn 70. ↩︎
- Hopefully in a week or two it will be down to five. ↩︎
- I do have a USD bank account (via CIBC) and a US credit card (ditto) to avoid FX charges, but my shiny new Rogers Red card also provides sufficient cashback on USD transactions to wipe out the extortionate FX rates charged by credit card companies. ↩︎
- Reverts to around $50 on its ex-dividend date, late in the calendar month. Except January, where ICSH doesn’t distribute at all, instead distributing twice in December. ↩︎
- Losses are unlikely because I trade frequently enough to fall under superficial loss rules. Best explanation of how this works at https://www.adjustedcostbase.ca/blog/what-is-the-superficial-loss-rule/ ↩︎
- Longer timeframe = higher risk acceptable = more equities ↩︎
- Here is a bit of problem. XSH is a short term bond fund; by rights, this should be a long term bond fund since the timeline of the investment is longer. Sigh. I picked this one because (a) it had corporate bonds and (b) it had a very low MER. ↩︎