Mini-Review: PortfolioPilot

I discovered PortfolioPilot (https://portfoliopilot.com/), a product of Global Predictions, because it’s mentioned in passing on Passiv’s dashboard. (You can read a bit about Passiv over here — the premium version of Passiv used to be offered for free to all Questrade users, but it’s now part of their shiny new subscription service1.)

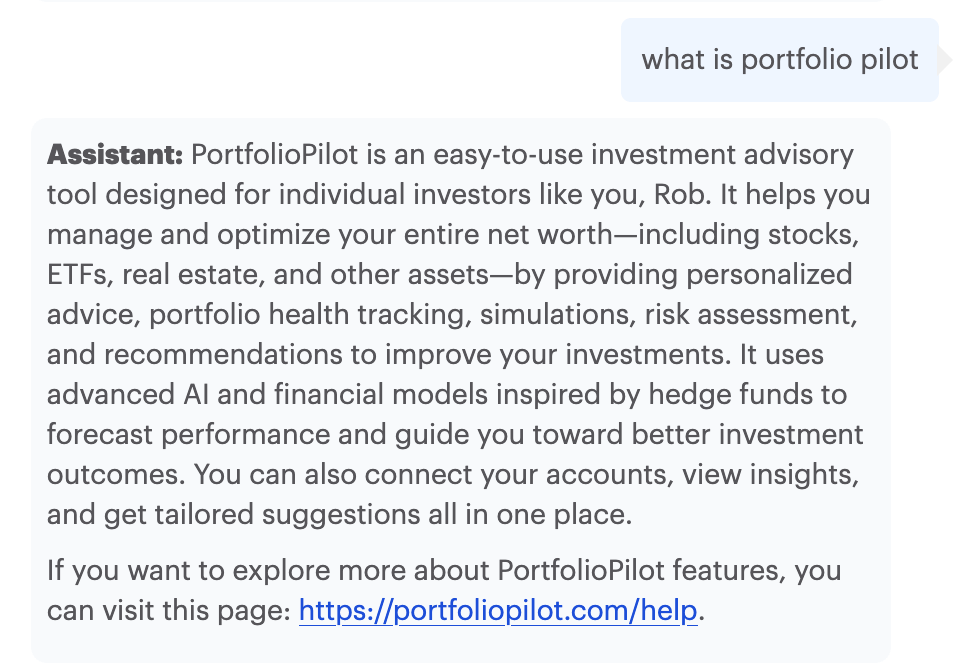
So what is PortfolioPilot? Let’s hand it over to their AI assistant to weigh in on that question 🙂

PortfolioPilot AI Assistant v1.3 explaining what it is

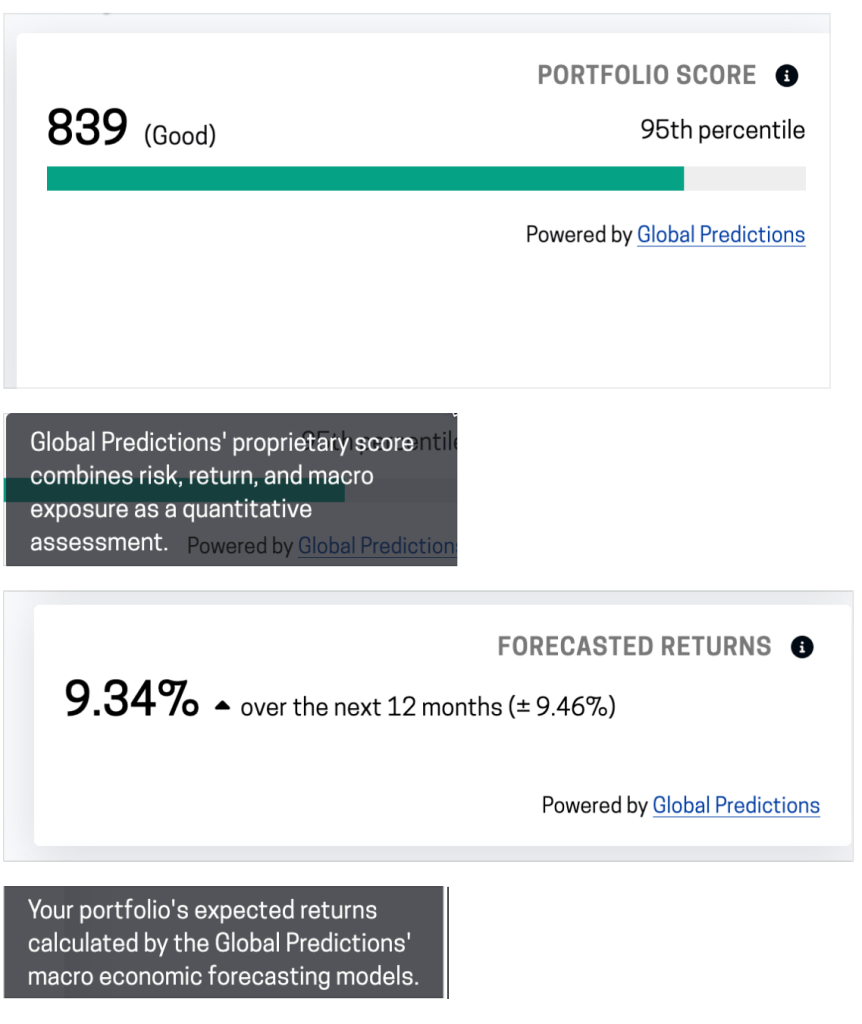
On Passiv, the data provided by PortfolioPilot is limited to a portfolio score (out of 1000) and a “Forecasted Return” metric. The Global Predictions/PortfolioPilot assessments for my portfolio as presented on the Passiv dashboard are depicted below.

Global Predictions/ Portfolio Pilot’s scoring of my portfolio, as depicted on the Passiv dashboard23

When I headed over to the PortfolioPilot website, I decided to set up an account and take a closer look.

After an initial set of questions to help figure out my risk profile, I was able to enter my entire portfolio manually, since it’s down to just 12 holdings these days. Pro tip: this is a US tool, so if you enter Canadian stocks/ETF, you have to add “.TO” to the name of the holding in question, e.g. XGRO.TO not just “XGRO”.

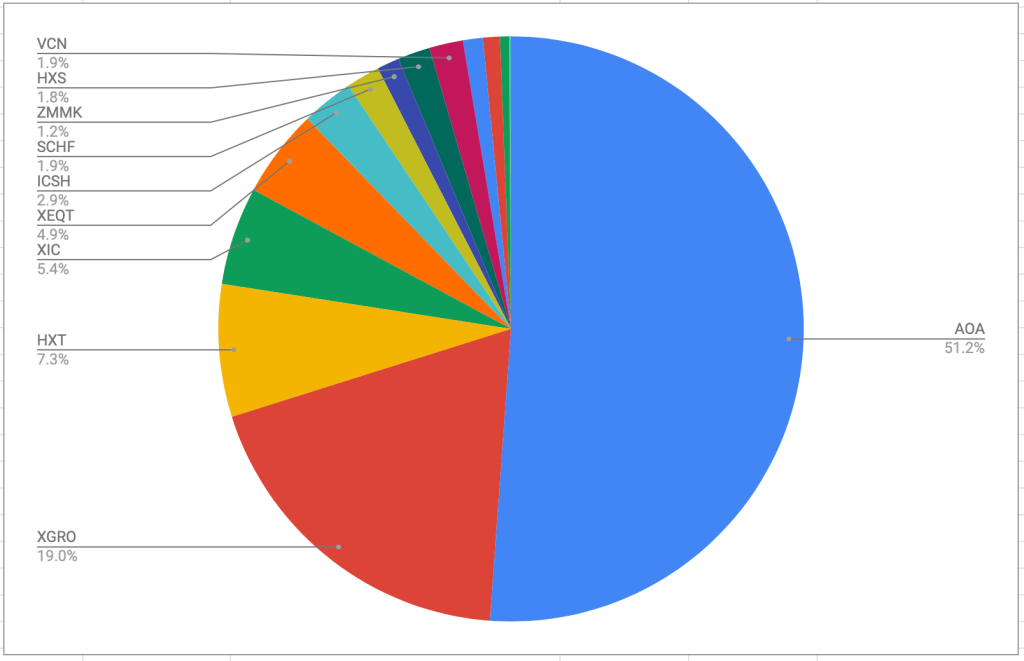
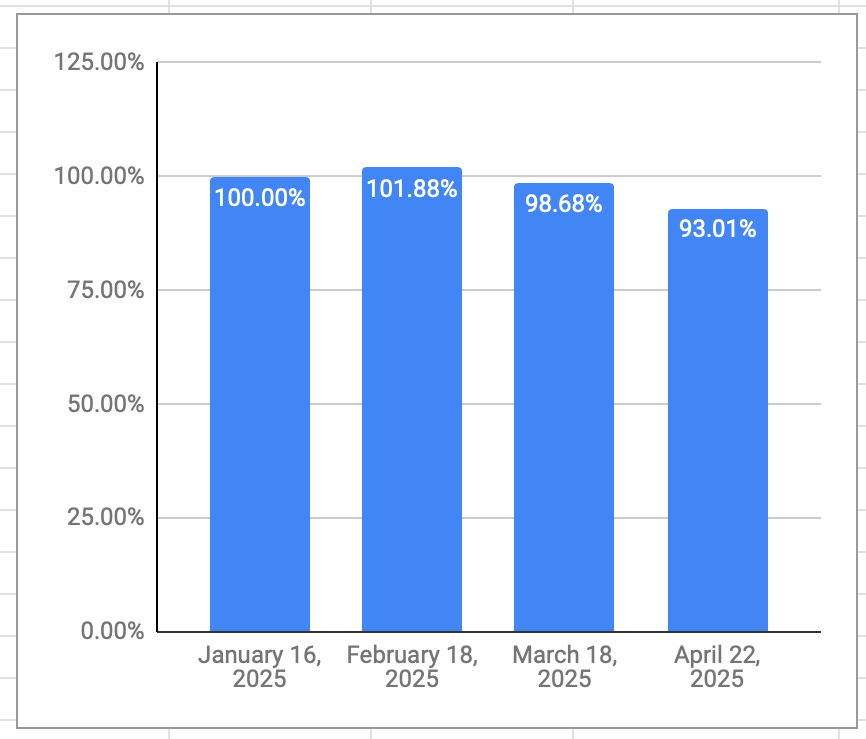
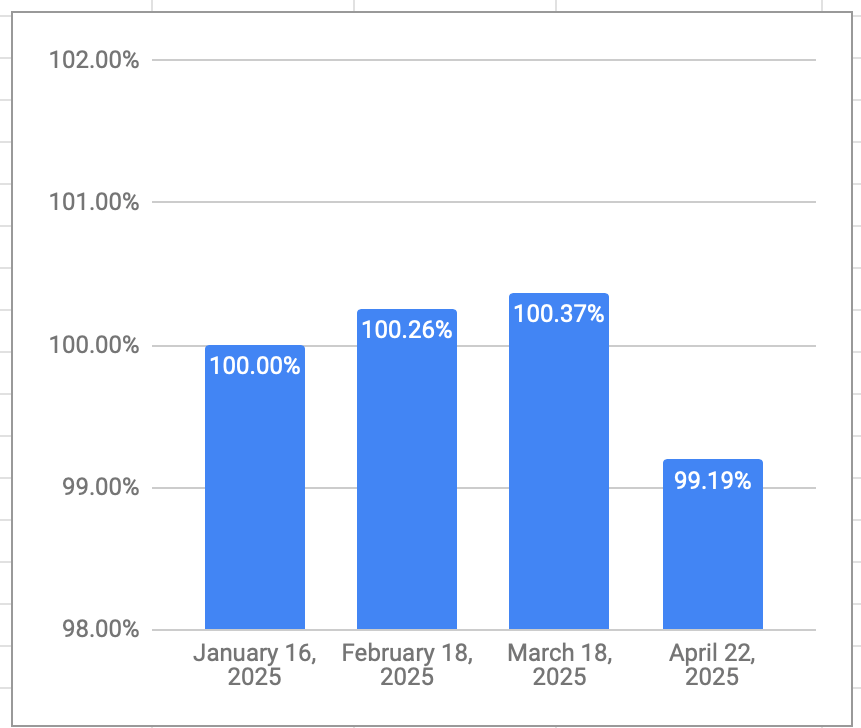
So once I did that, it spat out all kinds of pretty data. I do like the visualization per ETF held…this one is showing 3 month returns per ETF. Whether or not it’s including dividend payouts is not known.

3 month return of ETFs held in my retirement portfolio

It also gave me a little more insight into my portfolio score4:

Portfolio Score of my retirement holdings, per PortfolioPilot

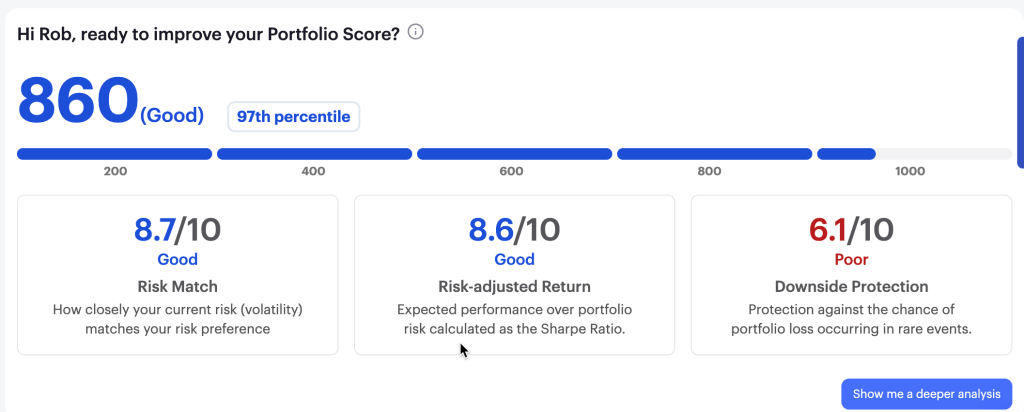
This view reminds me of how QTrade does their portfolio assessments, something I thought was a plus of that provider. The downside protection warning indicated that I have too much invested in too few holdings, but since I’m on the free version, no further insight was provided. Both AOA and XGRO are tilted towards large US stocks…I suppose my Magnificent Seven holdings are a non-trivial part of the overall portfolio as a result, but I wasn’t able to delve further into this warning. That’s what you get for paying nothing, I suppose.

So some nice stuff here, nice visualizations, customized news based on what’s in your portfolio, all good. But there are some problems I see with their data.

Example one:

PortfolioPilot Asset class view: 35% “unknown”? Blind spot for Canadian ETFs, maybe?

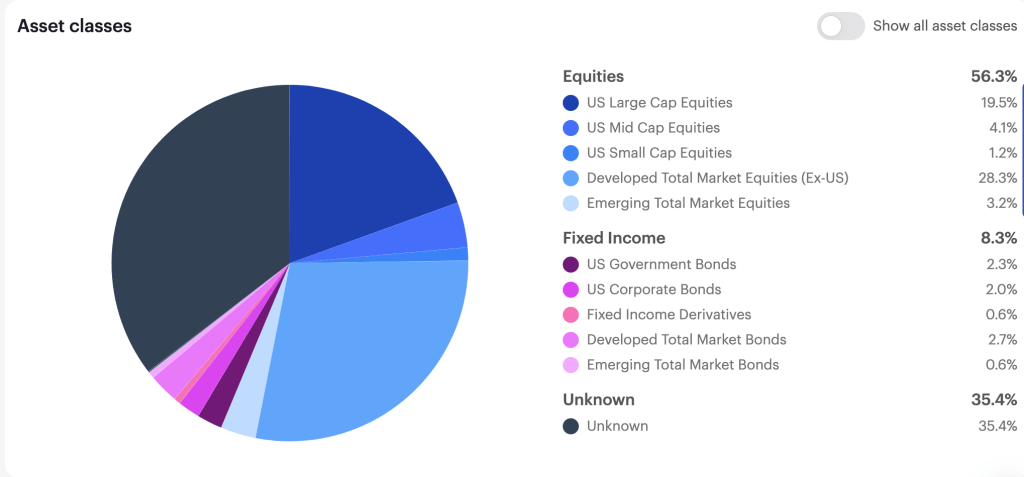
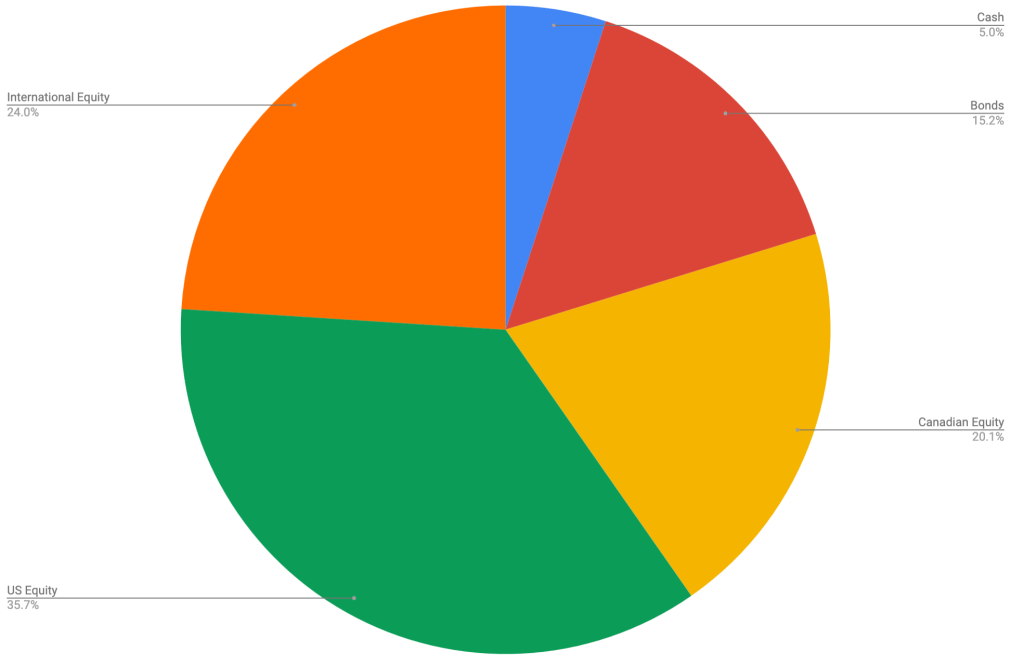
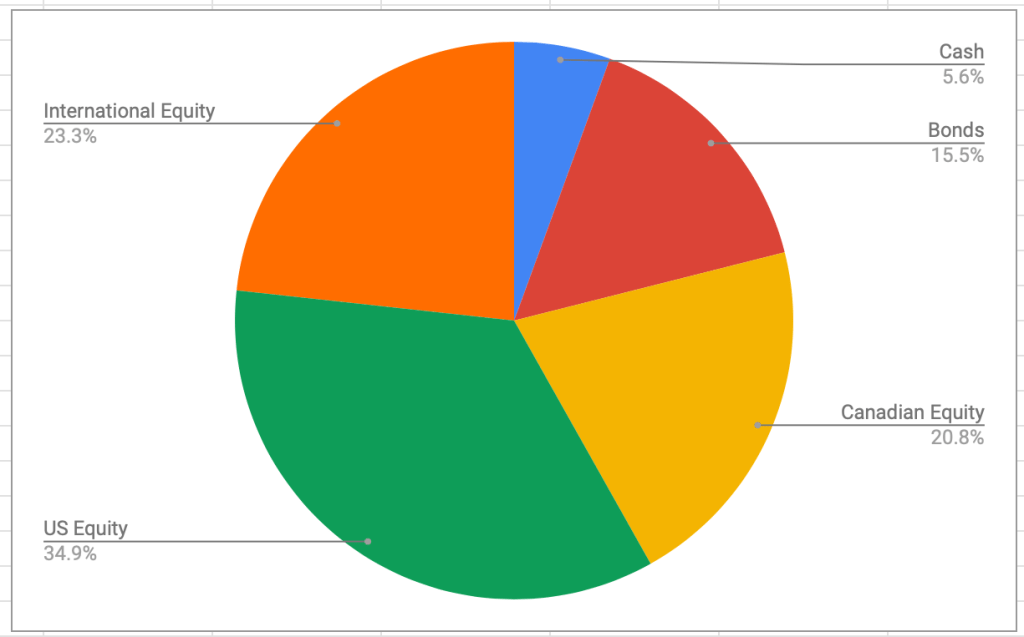
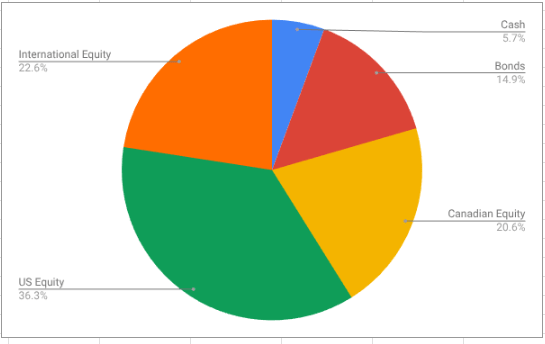
The asset breakdown is very detailed, which I like, but at 35% “unknown”, it’s kinda useless. No way I can see to figure out what ETFs are causing it trouble. Guess I’ll see what support has to say.

They have specific recommendations, which I also like, but again, I see issues:

PortfolioPilot suggested actions

So here, my issue is with action #2. It was recommending replacing XEQT (an ETF all-star) with VE.

Now, setting aside for a moment that VE and XEQT are pretty different in terms of what they hold, (to start, VE has no Canadian or Far East exposure), the REASON the suggestion was made was to save on management fees. PortfolioPilot claimed that VE attracted no fees, making me a sucker for paying 0.20% to hold XEQT. A quick look at the VE page dispelled that idea immediately — the MER is 0.22%. Following their advice would have led me to pay MORE in fees, not less. Shrug.

Anyway, I spent all of 30 minutes with this tool, and although it shows promise, some of the errors I spotted do not fill me with confidence in recommending it to others.

Anyone out there using it? Got other thoughts? Let me know at comments@moneyengineer.ca!

  1. But per some Reddit threads I have seen, users with more assets with Questrade may get it anyway. I await some sort of official communication before commenting further. As of right now, I still seem to have full access to the tool. ↩︎
  2. I dunno, 95th percentile seems “Excellent” to me.
    ↩︎
  3. Not really sure how to interpret that. Does that mean between 8% and 10% annual return, or does it mean -1% to 19% annual return? I would tend to believe the latter, since that’s more in line with an 80% equity portfolio, but no explanation is offered… ↩︎
  4. I suppose my score is a bit higher because it also includes my remaining QTrade holdings, which Passiv doesn’t support. Or maybe not. ↩︎

What’s in my retirement portfolio (May 2025)

This is a (hopefully monthly) look at what’s in my retirement portfolio. The original post is here. Last month’s is here.

Portfolio Construction

The retirement portfolio is spread across a bunch of accounts:

  • 7 RRIF accounts (3 for me, 3 for my spouse, 1 at an alternative provider as a test)
  • 2 TFSA accounts
  • 4 non-registered accounts1, (1 for me, 1 for my spouse, 2 joint)

The target for the overall portfolio is unchanged:

  • 80% equity, spread across Canadian, US and global markets for maximum diversification
  • 15% Bond funds, from a variety of Canadian, US and global markets
  • 5% cash, held in savings-like ETFs.

The view as of this morning

As of this morning, this is what the overall portfolio looks like:

Retirement holdings by ETF, May 2025

The portfolio is dominated by my ETF all-stars; anything not on that page is held in a non-registered account and won’t be fiddled with unless it’s part of my monthly decumulation. Otherwise I’ll rack up capital gains for no real benefit.

The biggest changes were caused by two events that happened over the past 30 days:

  • I did a small rebalancing exercise to reduce my exposure to the Canadian equity market, selling VCN in favor of XEQT. (XEQT is only 23% Canadian equity per dollar invested; VCN was 100%). This sort of rebalancing happens whenever I drift more than 1% off of my target allocations.
  • I took some cash from a HISA and invested it in ZMMK; for reasons too boring to report here, that money was effectively not being tracked in these pages until this month — that anomaly won’t be repeated in subsequent months since ZMMK and ICSH are where I park the “cash” position of my portfolio.

Plan for the next month

The asset-class split looks like this

This looks to be pretty close to my target percentages which haven’t changed:

  • 5% cash or cash-like holdings like ICSH and ZMMK
  • 15% bonds (almost all are buried in XGRO and AOA)
  • 20% Canadian equity (mostly based on ETFs that mirror the S&P/TSX 60)
  • 36% US equity (dominated by ETFs that mirror the S&P 500, with a small sprinkling of Russell 2000)
  • 24% International equity (mostly, but not exclusively, developed markets)

So, the plan for next month is, do nothing out of the ordinary. Reinvest cash (dividends, TFSA contributions) in one of AOA, XEQT/XGRO, ICSH or ZMMK depending on the asset category most in need on the day of the reinvestment. All these ETFs are covered on my ETF All-Stars page.

One thing I may do is to try to make shifts2 to get a little more return out of my cash position. US interest rates are quite a bit higher than Canadian rates, and so if my cash position is held in USD, I stand to eke a few more points of return there. TBD.

Overall

My retirement savings had a nice bounce-back this month, looks like I can cancel the mega-pack of pot noodles I had on order.

Monthly retirement savings, as percentage of Jan 2025 value

The salary I collect month to month recovered a bit, too, although not as quickly. That’s the magic of using VPW’s cash cushion — neither boom nor bust months translate into large changes in the take-home pay.

Monthly salary, as percentage of Jan 2025 salary

  1. That’s up one from the previous month. In order to collect on Questrade’s transfer bonus, (which they have yet to pay me, they are apparently in a world of hurt on the IT front) you have to have a non-registered account to get paid into. The other 3 are “normal” — one non-registered account for me, one for my spouse, and jointly held one that serves as a cash cushion to smooth out month to month variations in my retirement salary. Read more about that over at https://moneyengineer.ca/2025/01/31/im-retired-now-how-do-i-get-paid/ ↩︎
  2. With Questrade, all ETF trades are free to make, so I don’t have any real reason not to make such changes. ↩︎

What’s the deal with XEQT?

***updated this post to reflect the fact that XEQT has dropped XUS from its portfolio as of July 2, 2025***

This post is inspired by my original on the topic, “What’s the deal with XGRO“? XGRO is great, but since my target asset allocation is only 15% bonds, and XGRO’s bond target is 20%, there’s some tweaking I have to do in order to reduce the bond exposure. That tweak is increasingly being provided by XEQT, part of the same iShares family that produced XGRO.

(As mentioned elsewhere, I rely heavily on all-in-one ETFs in my retirement portolio. New to all-in-ones? Read a bit about them here.)

XEQT, like XGRO, is actually investing in thousands1 of different stocks. Unlike XGRO, it does not hold any bonds at all. I thought it would be interesting to see what, exactly, is underneath every $100 you invest in XEQT. See the results below:

FundWhat is it?How much?Compare with XGRO23
ITOT/ XTOT4Broad US stock coverage that tracks the S&P Total Market Index, about 2529 companies (top holdings: Apple, Nvidia, Microsoft, Amazon, Meta)$43.62 of your $100 investment$36.32 of your $100 investment
XEFBroad international (Europe, Asia, Australia) stock coverage that tracks the MSCI EAFE Investable Market Index, about 2500 holdings$25.25 of your $100 investment
$19.76 of your $100 investment
XICBroad Canadian stock coverage that tracks the S&P/TSX Capped Composite Index, about 223 companies (top holdings: RBC, Shopify, TD, Enbridge, Brookfield)$25.71 of your $100 investment
$20.09 of your $100 investment
XEC3000+ emerging market stocks that track the MSCI Emerging Markets Investable Market Index$5.04 of your $100 investment$4.07 of your $100 investment

The top 10 stocks of XEQT as of today looks like this:

TickerCompanyInvestment for every $100
NVDANvidia$2.99
MSFTMicrosoft$2.70
AAPLApple$2.26
RYRoyal Bank$1.67
AMZNAmazon$1.54
SHOPShopify$1.35
TDTD Bank$1.15
METAMeta$1.09
AVGOBroadcom$0.96
ENBEnbridge$0.88
Total$16.59
Top 10 holdings of XEQT as of July 25, 20255

The top stock holding outside North America belongs to Taiwan Semiconductor, at 46 cents for every $100 invested. Additionally, the geographic exposure looks like this:

Geographic exposure of XEQT as of July 25, 2025

One other little tidbit that might be interesting: the distribution yield of XEQT is 2.94% compared with 2.91% for XGRO. This I find a bit surprising, since I would have expected XGRO’s yield to be quite a bit better.

  1. 8,550 to be precise, as of today ↩︎
  2. As of today, might be different from when I wrote https://moneyengineer.ca/2025/01/30/whats-the-deal-with-xgro/ ↩︎
  3. And, if you’re really paying attention, you’ll see that the dollar amounts of this column add up to roughly $80, in keeping with the 80/20 philosophy of XGRO. ↩︎
  4. i lump these together because they hold exactly the same thing. Some loophole that iShares needs to exploit, I gather. ↩︎
  5. On the date I pulled these numbers, cash cracked the top 10 for a holding of $1.34, which is not usual, so I just dropped it. Not sure why that is…perhaps by the end of the month it will resolve itself. ↩︎

What’s in my retirement portfolio (April 2025)

This is a (hopefully monthly) look at what’s in my retirement portfolio. The original post is here. Last month’s is here.

Portfolio Construction

The retirement portfolio is spread across a bunch of accounts:

  • 7 RRIF accounts (3 for me, 3 for my spouse, 1 at an alternative provider as a test)
  • 2 TFSA accounts
  • 3 non-registered accounts1, (1 for my spouse, 2 joint)

The target for the overall portfolio is unchanged:

  • 80% equity, spread across Canadian, US and global markets for maximum diversification
  • 15% Bond funds, from a variety of Canadian, US and global markets
  • 5% cash, held in savings-like ETFs.

The view as of this morning

As of this morning, this is what the overall portfolio looks like:

Overall retirement portfolio by holding, April 2025

The portfolio, as always, is dominated by AOA and XGRO which are 80/20 asset allocation funds in USD and CAD, respectively. The rest are primarily either cash-like holdings in two ETFs: ZMMK in CAD and ICSH in USD) or residual ETFs held in non-registered accounts for which I don’t want to create unnecessary capital gains just for the sake of holding AOA or XGRO.

The biggest month over month change was a small decline in AOA and a small uptick in XEQT, about a 1% shift overall. This was because I shifted some of my USD assets to CAD assets in the RRIF using Norbert’s Gambit2. I chose XEQT over XGRO because the contribution of bonds in the portfolio was slightly over my asset allocation target3. XEQT is essentially XGRO, minus the bond holdings (it’s a 100% equity fund).

There was also a noticeable reduction in the contribution of ICSH to the portfolio; this was largely due to the unfavourable change in the USD/CAD exchange rate over the course of the month, and not due to any change in the holdings there.

Plan for the next month

The asset-class split looks like this

Overall retirement portfolio by market, April 2025

This looks to be pretty close to my target percentages which haven’t changed:

  • 5% cash or cash-like holdings like ICSH and ZMMK
  • 15% bonds (almost all are buried in XGRO and AOA)
  • 20% Canadian equity (mostly based on ETFs that mirror the S&P/TSX 60)
  • 36% US equity (dominated by ETFs that mirror the S&P 500, with a small sprinkling of Russell 2000)
  • 24% International equity (mostly, but not exclusively, developed markets)

So, the plan for next month is, do nothing out of the ordinary. Reinvest cash (dividends, TFSA contributions) in one of AOA, XEQT/XGRO, ICSH or ZMMK depending on the asset category most in need on the day of the reinvestment. All these ETFs are covered on my ETF All-Stars page.

Overall

My retirement savings declined 5.75% over the month (down 7% since January) due to the continuing meltdown in the equity markets. It’s not a pretty picture!

Net worth of retirement savings compared to start of retirement

This has not translated to a the same degree of change in my monthly salary. Why? My retirement payouts are calculated by Variable Percentage Withdrawal (VPW), which I cover here. VPW has a built-in cash cushion, which serves to dampen month to month swings in my net worth, either up or down. As you can see in the chart below, my monthly salary has stayed within a 1% band of the first salary I drew in January.

Month over month salary, as compared to start of retirement

  1. Since Questrade combines USD and CAD assets under the same account umbrella, I was able to reduce the number here. ↩︎
  2. I shift funds from the USD to the CAD side of the RRIF more or less quarterly since all RRIF payments are currently coming out of the CAD side of the portfolio. ↩︎
  3. That’s the optimistic point of view; it’s perhaps more accurately stated as “bonds haven’t melted down quite as much as the equity portion of my portfolio”. ↩︎

How I think about investing: Asset classes

Passive investing while ensuring good diversification has been my strategy for decades. But how do I define “diversification”? For me, it’s always been about paying attention to how much of my total portfolio was invested in each of five1 asset classes and keeping them aligned with my targets:

  • Cash or cash equivalents
  • Bonds2
  • Canadian Stocks
  • US Stocks
  • International Stocks3

I got this idea from my last financial advisor who provided me with a lovely Cerlox4 bound annual report showing me how hard they were working on my behalf5. The report included a pie chart of how my investments broke down. This is what that pie chart looks like in my portfolio this morning:

Retirement portfolio by asset class, March 28, 2025

This pie chart has been my guiding principle: have a target percentage for each asset class in mind, and adjust your portfolio as needed to keep the percentages in line. This simple principle has been adopted by so-called asset allocation ETFs aka “all-in-ones” like (my personal favourites) XGRO6 and AOA7.

But are these even the right asset classes? Where are REITs8? Where’s precious metals? Where’s Bitcoin9? What’s your bond duration? Do you have enough exposure to high-growth geographies?

Short answer: just like I’m too lazy to pick stocks, I’m too lazy (and not smart enough) to pick a “winner” of a given asset class. The “periodic table” of investment returns by asset class is a must-read for DIY enthusiasts out there: https://themeasureofaplan.com/investment-returns-by-asset-class/ (go ahead, take a look, I’ll wait).

The folks at Measure of a Plan agree that trying to figure out the “hot” asset class is a very difficult task:

It’s no easy feat to pick the winner in a given year. The asset class rankings appear to be randomly tossed about over time, with the top performer in one year often falling down to the middle or bottom of the table in the next year.

https://themeasureofaplan.com/investment-returns-by-asset-class/

By keeping an eye on the pie chart, and shifting investments to align with my targets, I’m never at risk at being overweight in any one asset-class, and beaten-down asset-classes naturally get more funds to get the percentages right. It’s naturally causing “buy low, sell high” behaviour.

So: what about the asset classes I’m using? Are 5 asset classes too many? Too few? I don’t know. “Good enough” is sort of my philosophy in the spirit of trying to keep things simple.

The spreadsheet I’ve used to help me track my portfolio breakdown is found here. In future posts, I’ll talk a bit about how to make it work for you.

  1. For a long time, “cash” was not part of the consideration. Leading up to retirement, I started to carry a 5% cash weighting to help cushion market swings. ↩︎
  2. In years past, I did try to keep track of short-term versus mid-term versus long-term bonds. I gave up on that. ↩︎
  3. In years past, I did try to keep track of developed markets versus emerging markets. I gave up on that. ↩︎
  4. I had to look up how this was spelled. https://www.collinsdictionary.com/dictionary/english/cerlox ↩︎
  5. The fact that this report looked the same as the reports generated by two other advisors led me to the conclusion that my hard working advisor was perhaps being assisted by commercial software. ↩︎
  6. Overview of XGRO’s asset allocation strategy: https://www.blackrock.com/ca/investors/en/literature/product-brief/ishares-core-etf-portfolios-brochure-en.pdf ↩︎
  7. Overview of AOA’s asset allocation strategy: https://www.ishares.com/us/literature/product-brief/ishares-core-esg-allocation-brief.pdf ↩︎
  8. My first list of asset classes prepared circa 20 years ago did include REITs but I dropped that class, figuring (perhaps incorrectly) that the bond portion of the portfolio was good enough. Doing a bit of digging, I see that both AOA and XGRO hold REITs, and both consider them “equity” investments. ↩︎
  9. It’s actually obligatory for any article on investing to mention one (or more) cryptocurrencies, and/or one (or more) meme stocks 😉 ↩︎