This is a monthly look at what’s in my retirement portfolio. The original post is here. Last month’s is here.
Portfolio Construction
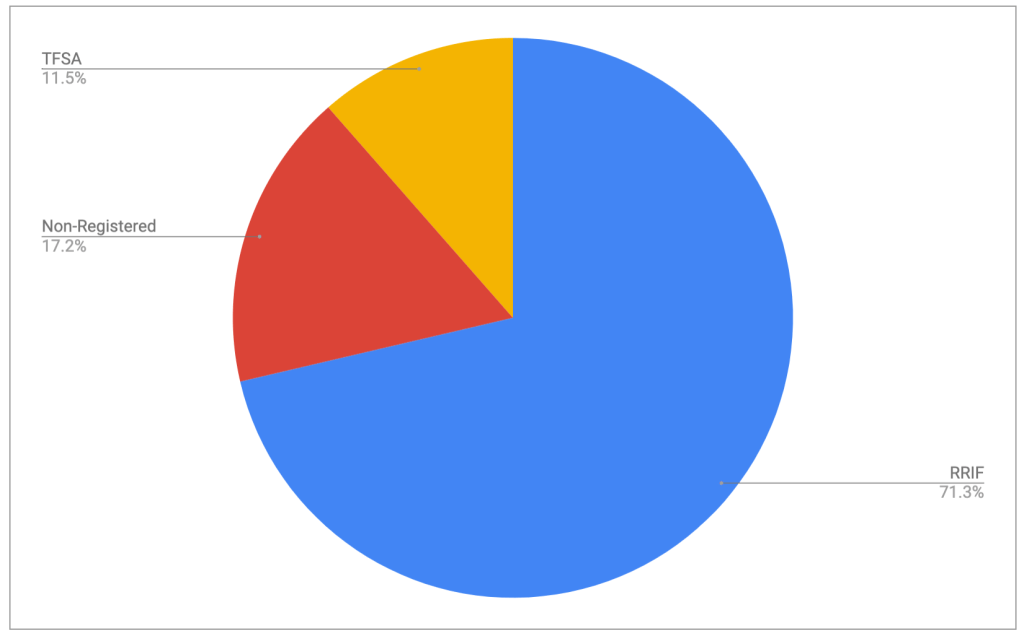
The retirement portfolio is spread across a bunch of accounts:
- 7 RRIF accounts (3 for me, 3 for my spouse, 1 at an alternative provider as a test)
- 2 TFSA accounts
- 4 non-registered accounts, (1 for me, 1 for my spouse, 2 joint)
The target for the overall portfolio is unchanged:
- 80% equity, spread across Canadian, US and global markets for maximum diversification
- 15% Bond funds, from a variety of Canadian, US and global markets
- 5% cash, held in savings-like ETFs.
You can read about my asset-allocation approach to investing over here.
The view post-payday
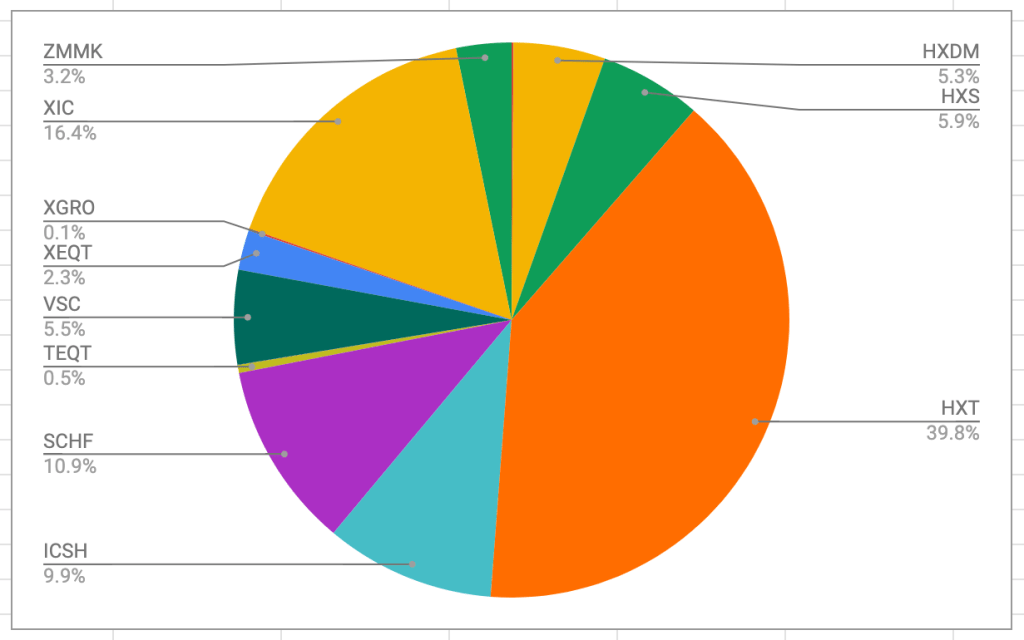
I pay myself monthly in retirement, so that’s a good trigger to update this post. On October 27th, this is what it looks like:
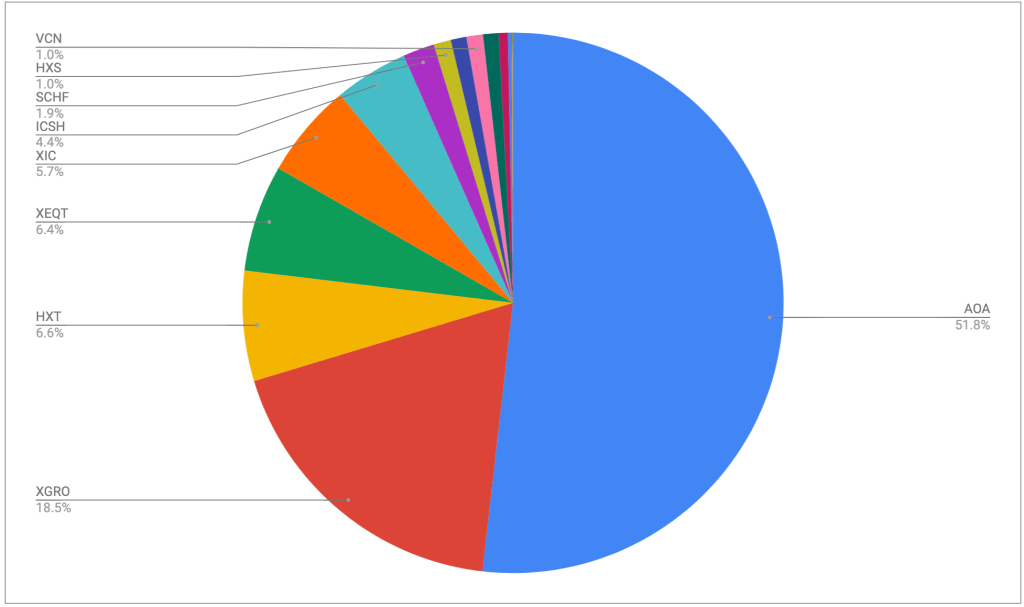
The portfolio is dominated by my ETF all-stars; anything not on that page is held in a non-registered account and won’t be fiddled with unless it’s part of my monthly decumulation. Otherwise I’ll rack up capital gains for no real benefit.
No massive changes this month; the one you might notice is a slight shift from AOA to XGRO. I move some of my USD holdings into CAD every quarter, and last month was when I did it. The majority of my spending is in CAD, so I use Norbert’s Gambit to move funds around.
Plan for the next month
The asset-class split looks like this
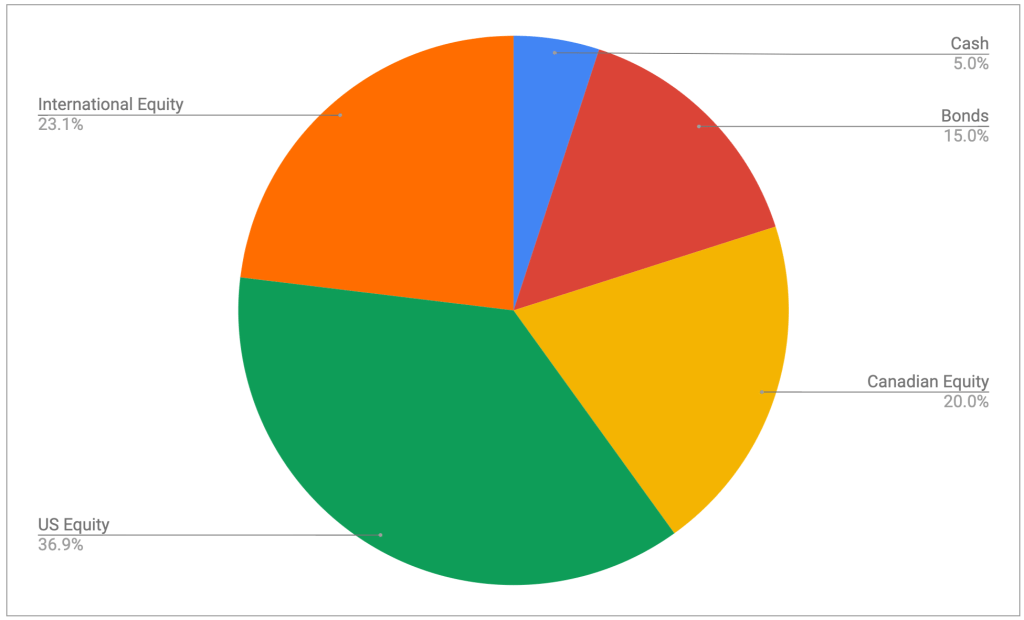
It’s looking pretty close to the targets I have, which are unchanged:
- 5% cash or cash-like holdings like ICSH and ZMMK
- 15% bonds (almost all are buried in XGRO and AOA)
- 20% Canadian equity (mostly based on ETFs that mirror the S&P/TSX 60)
- 36% US equity (dominated by ETFs that mirror the S&P 500, with a small sprinkling of Russell 2000)
- 24% International equity (mostly, but not exclusively, developed markets)
All looks to be in order from an asset allocation perspective, no need to do anything here.
Overall
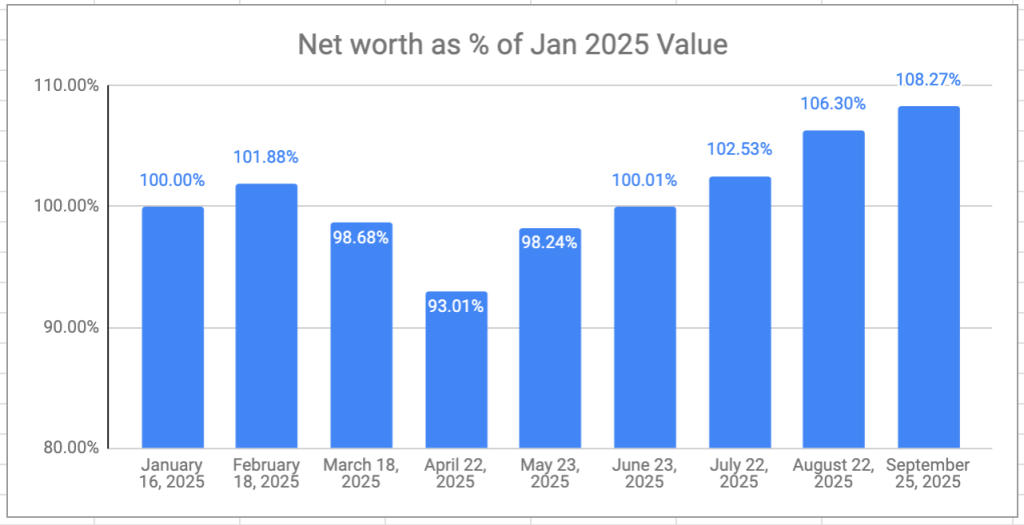
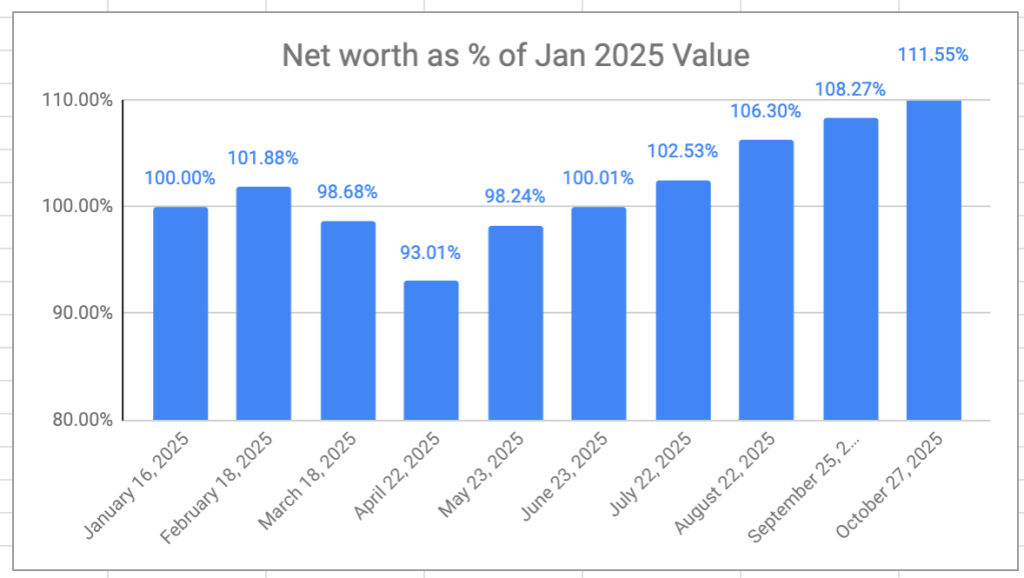
The retirement savings had a great month, again — a 6-month growth streak at this point. Overall, I’m now 11.5% ahead of where I started even though I’ve been drawing a monthly salary since the beginning of the year. I don’t really expect the winning streak to continue, but VPW allows me to take some benefit from the frothy stock markets at moment.
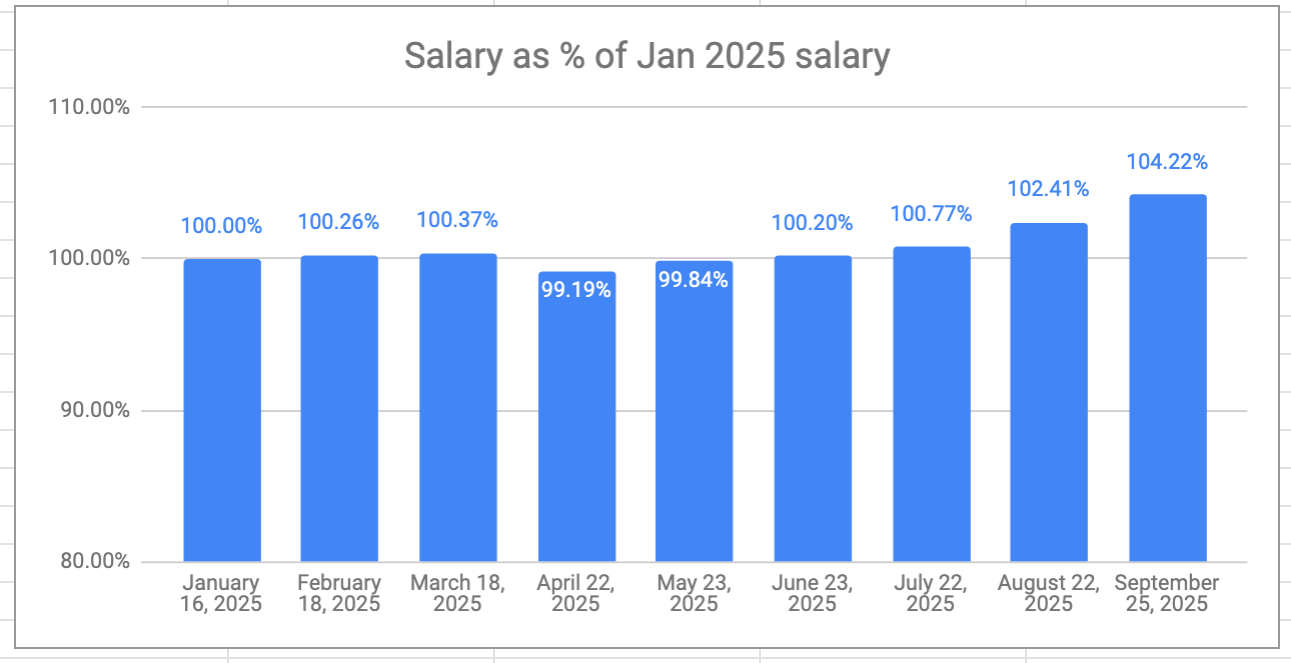
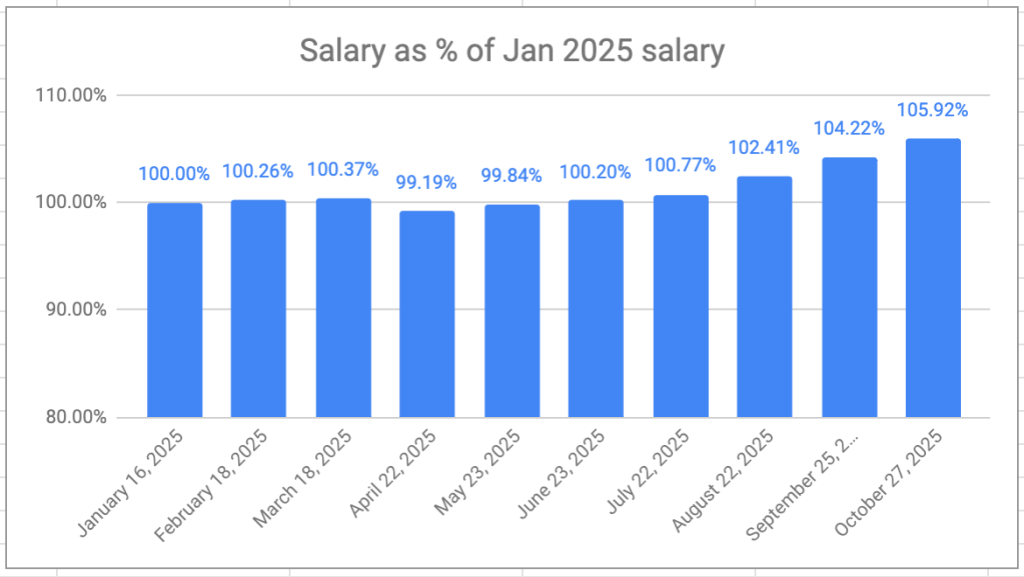
My VPW-calculated salary has hit a new high this year, 5.92% higher than my first draw in January. The monthly salary is also on a 6-month growth streak.
The months ahead will see the final “goodbye” to QTrade1 as the last of my RRIF investments will move to (mostly) Questrade2.
- I didn’t have a great deal of issue with QTrade as a provider, but their support (lack thereof) was beginning to become irritating. ↩︎
- My own QTrade RRIF will join the RRIF holdings I already have with Wealthsimple. They remain a potential backup provider of my retirement savings. I would have moved more to take advantage of their cashback promotion, but they still, inexplicably, do not support self-directed spousal RRIF accounts. ↩︎