People still working are always fascinated with what a recent retiree gets up to. I guess the short answer is that I’m still busy, still procrastinating, still learning — but with far fewer constraints on how I spend my day.
This Blog
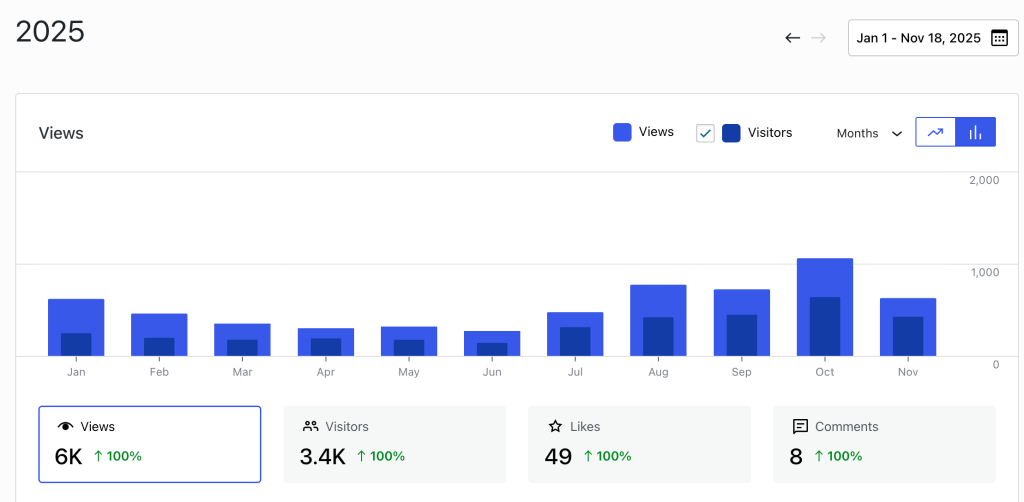
MoneyEngineer.ca was an idea that grew out of something I had been doing occasionally before I retired. I would discover something interesting in the world of being a DIY investor or in being a cheapskate and I would tell a bunch of friends and family about it, usually via email. But I figured that I could tell more people about what I’ve learned by starting a blog.
Knowing my procrastination habits, I took steps to make sure I would get that going on day 1. So in late December 2024 I prepurchased 2 years of WordPress and registered a domain. Investing a bit of cash in my proposed endeavor I knew would motivate me to actually DO it.
The time I spend on the blog now versus the early days has diminished quite a bit (partly because I’m now way more familiar with how WordPress works) but I enjoy the structure of heading down to the basement office and doing the work of researching and putting words on the page. And watching the website grow in popularity has also been gratifying. So thanks to all for reading and sharing!
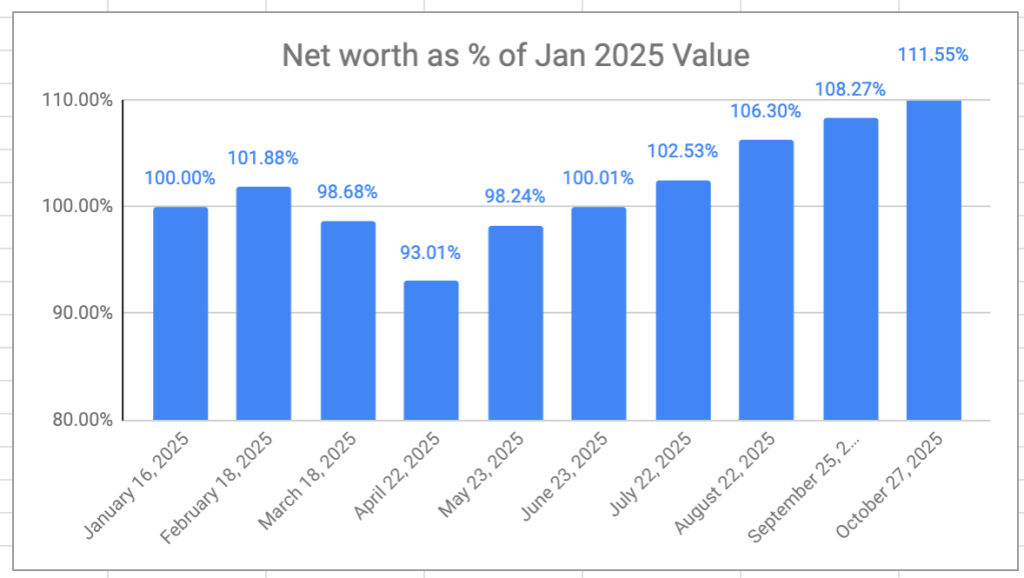
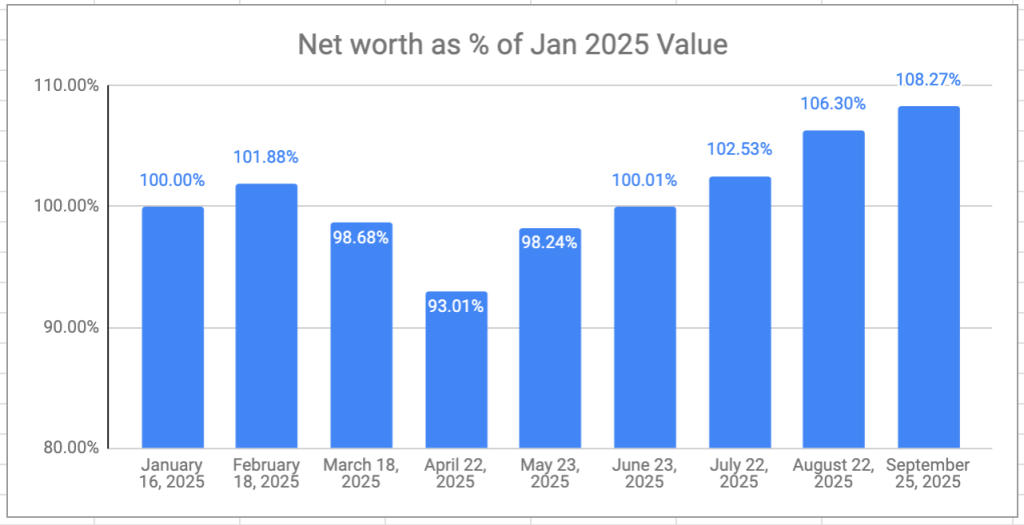
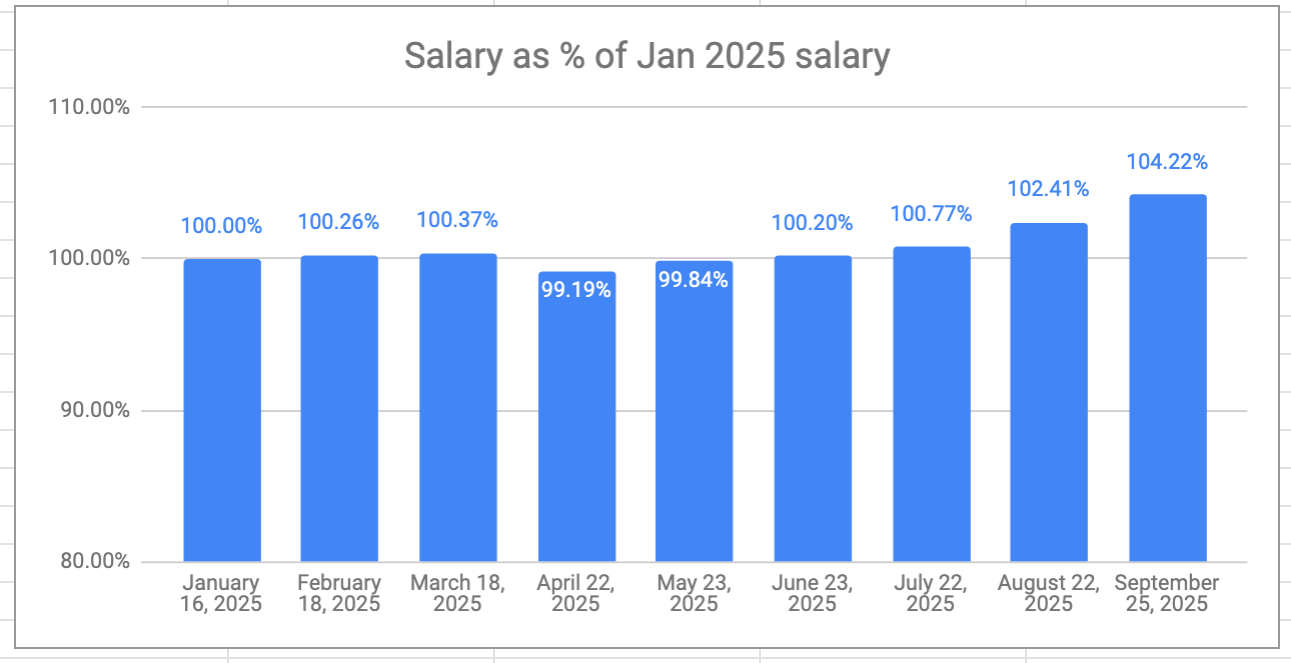
Managing Money
I do enjoy managing my own retirement income, and chasing whatever deal gets thrown my way. And I do try to simplify as much as I can. Being a cheapskate sometimes has the cost of adding complexity, it’s true. And outside the blog, I’m a frequent contributor to investing-related subreddits.
Volunteering
There are many organizations out there who are happy to put a recent retiree to work either on a recurring or on a one-off basis. Getting out of the house is a good thing, I figure. Here are a few of the places I’ve spent my time:
- Catalyste+: https://www.catalysteplus.org/volunteer-with-us/ links professionals with businesses who are looking for a bit of mentorship. I’m starting my first consulting gig with a business based in the Yukon.
- Volunteer Ottawa: https://volunteerottawa.ca/volunteer/ This is a community hub, and many local charities post their needs here. I’ve been doing some social media and web work for GottaGo. I also do some work on behalf of United For Literacy.
- Ontario Network for Education (ONFE): https://onfe-rope.ca/how-to-get-involved/volunteer/ allows me to volunteer to help teach English to adults.
- parkrun: https://www.parkrun.ca/. I run or volunteer at my local parkrun most Saturdays, and am trying to launch one for my neighbourhood.
- I served as a standardized patient for our local med school, but this was actually a paid gig1
- I’ve done some work for the National Archives, digitizing old documents.
- I am installing (this week, I think) a rain gauge to participate in the work of CoCoRAHS
- And from time to time I do edits on Wikipedia or use my eyes to help projects hosted on Zooniverse
Fitness
I’ve always been a fan of outdoor exercise — gyms have zero appeal for me, and so even before I retired I made a habit of getting outside to ski, ride, run or walk thirty minutes four to five times a week. In retirement, I’ve become more interested in running and entered my first distance races this year; to avoid injury, I’ve added more miles and more structure2.
I have never liked strength training, but know that as I get older, that’s something I have to pay attention to. I recently discovered darebee.com and am following their strength training program; lots of variety and it’s mostly based on body weight exercises, so I can do them practically anywhere.
Piano
Both my kids took lessons and we own an upright as a result. The kids are both out of the house and instead of letting the instrument collect dust, I’ve started learning myself.
Once again, in order to prevent myself from avoiding doing the daily work, I invested in an annual subscription to pianote.com3. I suppose most accomplished musicians would frown upon anything other than in-person, tailored lessons, but the approach of pianote really appealed to me: playing songs but with enough technique to build skills.
On most days, I spend between 30 and 60 minutes at the piano. I’m currently working on the piano accompaniment to “Someone Like You“.
So there you have the view of what this retiree gets up to — what have you found that fills your days after work? Let me know at comments@moneyengineer.ca. I’m always curious about new things to try!