High Interest Savings Page Updated
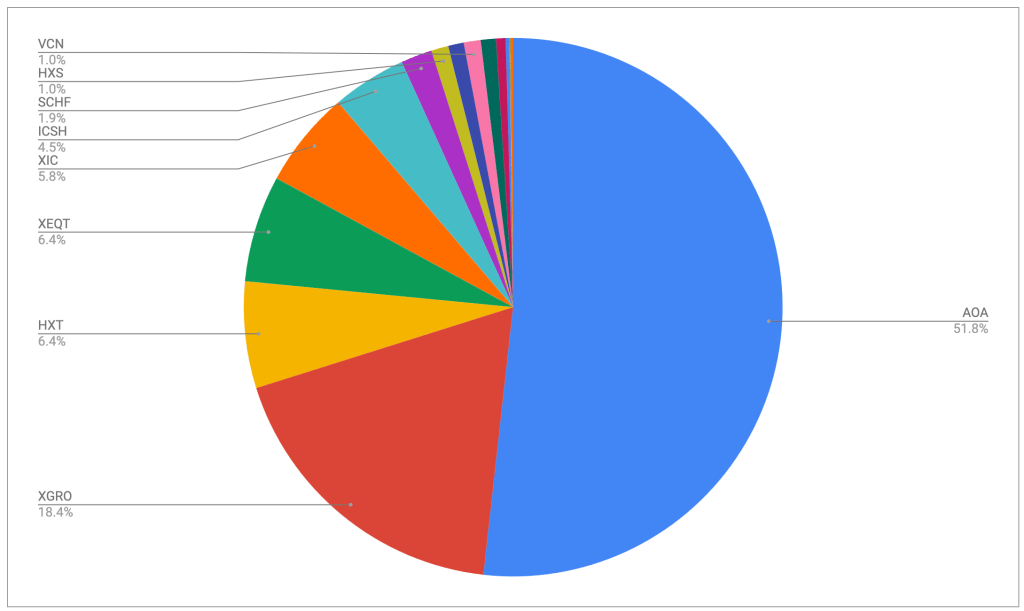
As reported last week, the USA cut their prime rates while Canada did not. The latest rates are now reflected in the HISA and short-term bond table (Canada & US). No changes for at least 6 weeks at this rate. Most cash I hold in my retirement savings is invested in an ultra-short-term bond fund, namely ICSH (one of my ETF all-stars) so I can squeeze out a few more basis points on my cash holdings.
TD Cuts Trading fees on 100 ETFs
TD seems to be upping its game. Not only are they throwing free money around, but an observant reader (thanks, big brother 🙂 ) alerted me to a recent change. You can read all about it here, but the skinny is that they cut trading fees on a list of 100 ETFs. Paying trading fees of any kind seems to be a dying business model, so it’s nice to see TDDI join the free club, at least a little bit. Some of these ETFs are even worth holding; I’ll save you the trouble and show you which ones:
| Name | Symbol | What it holds |
|---|---|---|
| Vanguard S&P 500 Index | VFV | Largest US Companies |
| SPDR S&P 500 | SPY | Largest US Companies in USD |
| Vanguard 500 Index | VOO | Same as SPY |
| iShares Russell 2000 | IWM | Small cap US Equity in USD |
| TD all-in-ones | TEQT, TGRO, TBAL, TCON | 100% Equity, 90% Equity, 60% Equity, 30% Equity. Read more here and here. |
| TD Aggregate Bond Index | TDB | Canadian gov’t and corp bonds.1 |
| TD International Equity | TPE | Developed international market equity.2 |
| TD US Equity | TPU/TPU.U | Similar to VFV/SPY3 |
| TD Canadian Equity | TTP | 300 Canadian stocks (aka “the Canadian market”)4 |
| TD Cash Management | TCSH/TUSD.U | Ultra short term debt in CAD/USD5 |
| Vanguard all-in-ones | VEQT, VGRO, VBAL, VCNS | 100% Equity, 80% Equity, 60% Equity, 40% Equity |
| Vanguard Canadian Agg Bond | VAB | Canadian gov’t and corp bonds6 |
| Vanguard FTSE Global | VXC | All equity ex-Canada (65% US Equity) |
| Vanguard FTSE Developed | VIU | All developed equity ex-North America7 |
| Vanguard US Total Market | VUN/VTI | ~3500 US Stocks in CAD/USD (aka “The US Market”)8 |
| Vanguard FTSE Canada | VCN | Top 200 Canadian Stocks, so similar to TTP9 |
All the above funds would be worthy of consideration since they adhere to my rules about being passively managed, low cost, and aligned with my asset-allocation strategy. The simplest purchases here would be one of the TD or Vanguard all-in-ones (new to all-in-ones? read about them here) best aligned with your risk profile. There’s a bunch of other ones that aren’t of interest to me — bitcoin, leveraged, actively managed, segment-based…nah, I’m good.
- Used in TGRO, TBAL, TCON ↩︎
- No “emerging” market exposure. Used in TEQT, TGRO, TBAL, TCON ↩︎
- TPU is used in TEQT, TGRO, TBAL, TCON ↩︎
- Used in TEQT, TGRO, TBAL, TCON ↩︎
- Similar to my use of ZMMK/ICSH ↩︎
- Used in VGRO, VBAL, VCNS ↩︎
- Used in VEQT, VGRO, VBAL, VCNS ↩︎
- Used in VEQT, VGRO, VBAL, VCNS ↩︎
- Used in VEQT, VGRO, VBAL, VCNS ↩︎