This is a monthly look at what’s in my retirement portfolio. The original post is here. Last month’s is here.
Portfolio Construction
The retirement portfolio is spread across a bunch of accounts:
- 7 RRIF accounts (3 for me, 3 for my spouse, 1 at an alternative provider as a test)
- 2 TFSA accounts
- 4 non-registered accounts, (1 for me, 1 for my spouse, 2 joint)
The target for the overall portfolio is unchanged:
- 80% equity, spread across Canadian, US and global markets for maximum diversification
- 15% Bond funds, from a variety of Canadian, US and global markets
- 5% cash, held in savings-like ETFs.
You can read about my asset-allocation approach to investing over here.
The view post-payday
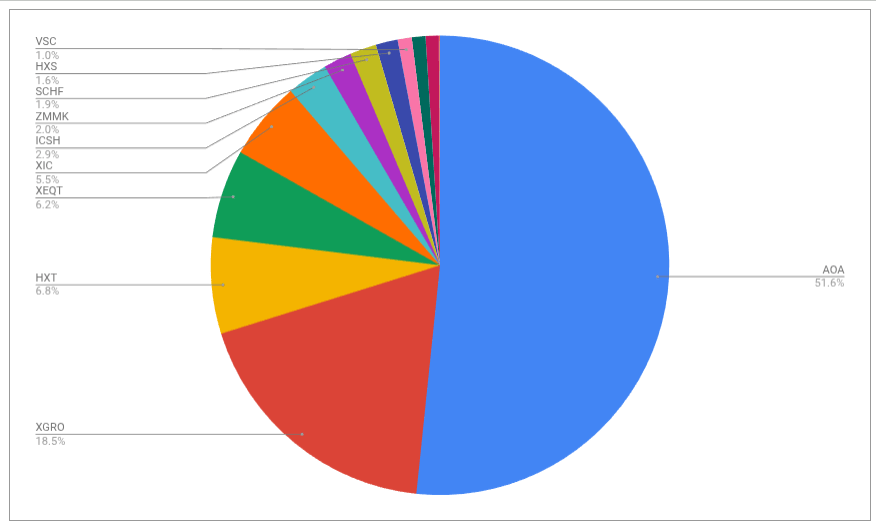
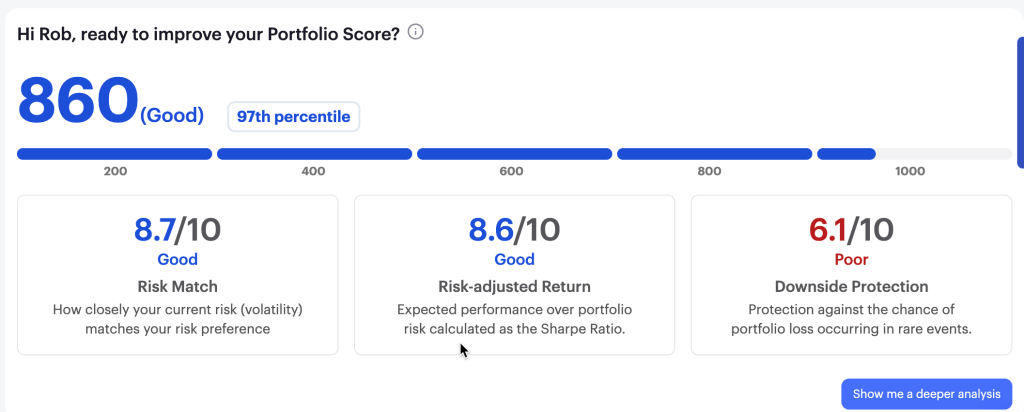
I pay myself monthly in retirement, so that’s a good trigger to update this post. At market close, August 22, this is what it looks like:
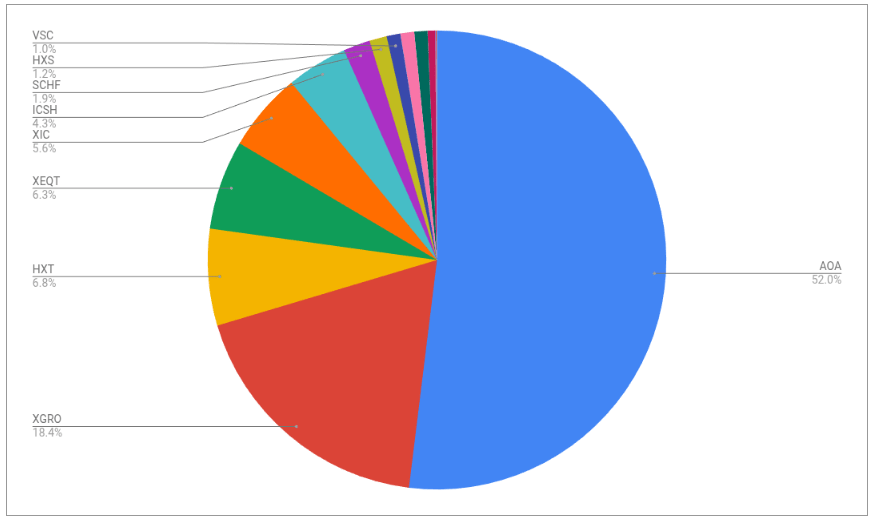
The portfolio is dominated by my ETF all-stars; anything not on that page is held in a non-registered account and won’t be fiddled with unless it’s part of my monthly decumulation. Otherwise I’ll rack up capital gains for no real benefit.
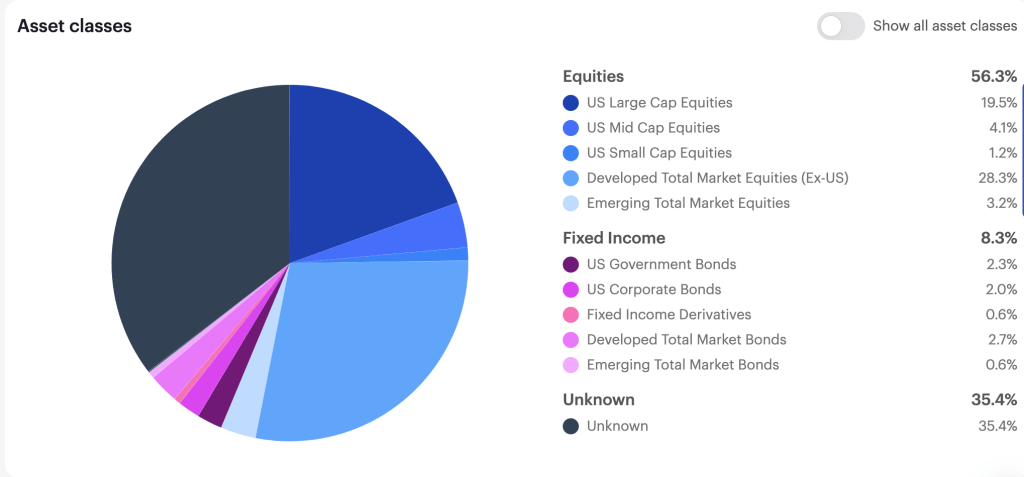
The most noticeable change is a growth in the importance of ICSH to my portfolio at the expense of ZMMK. I did the math to justify performing a Norbert’s Gambit of the CAD generated by selling ZMMK and picking up ICSH. The amount of HXS remaining in the portfolio is dwindling, and may be gone altogether by next month. I choose which assets to sell out of my non-registered accounts by simply determining which asset category needs to be trimmed based on my multi-asset spreadsheet.
I also have a new way to track my AOA splits; since it rebalances itself twice annually, it seems to me wiser to fix its bond contribution at 20% in my multi-asset tracker. The equity splits between US, International, and Canadian are still dynamically calculated at least monthly using a properly weighted formula.
Plan for the next month
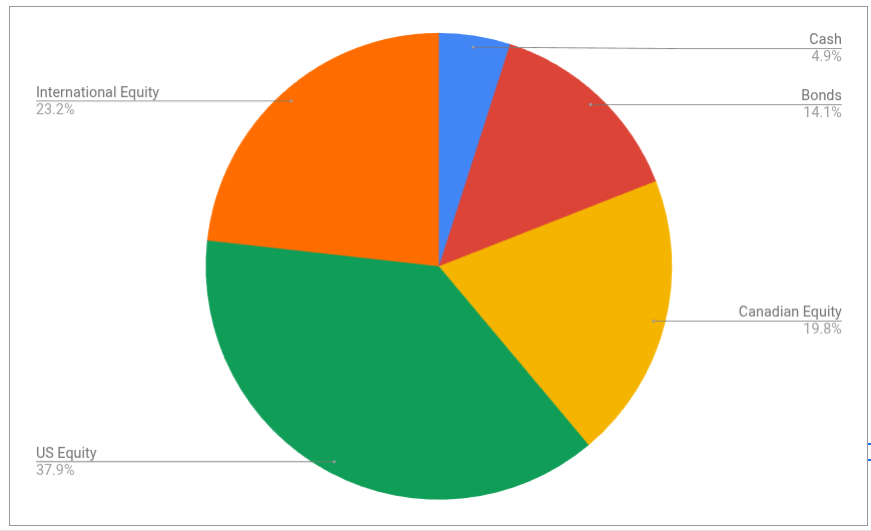
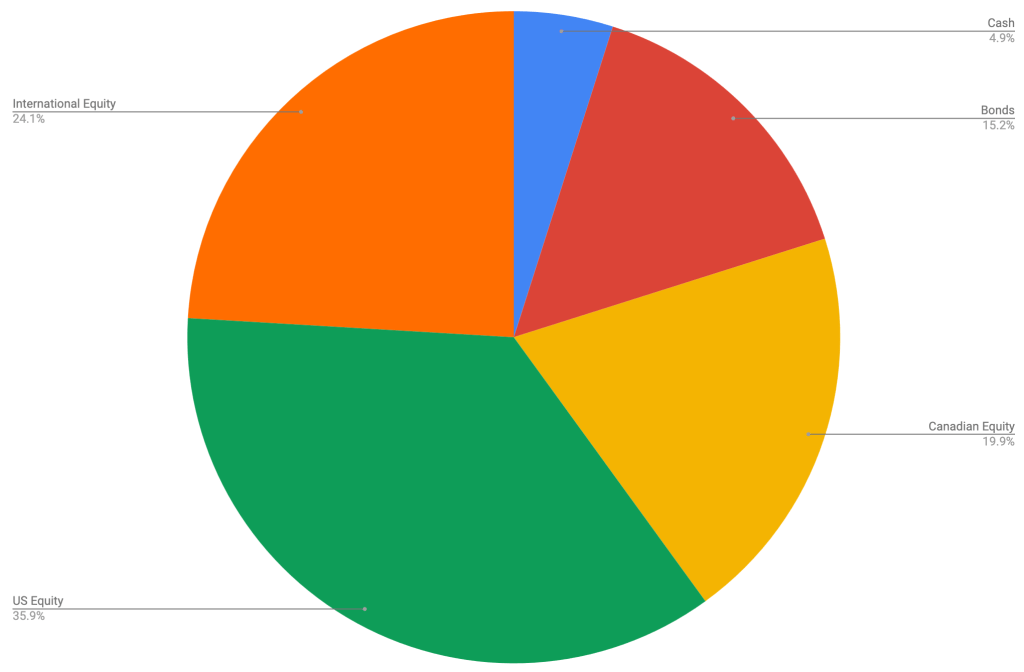
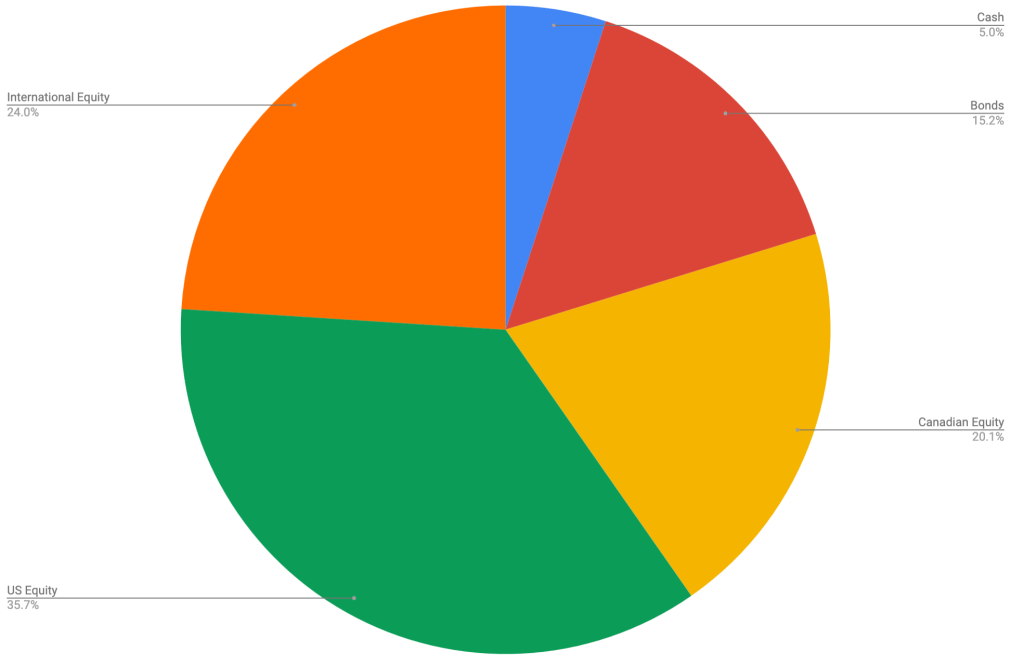
The asset-class split looks like this
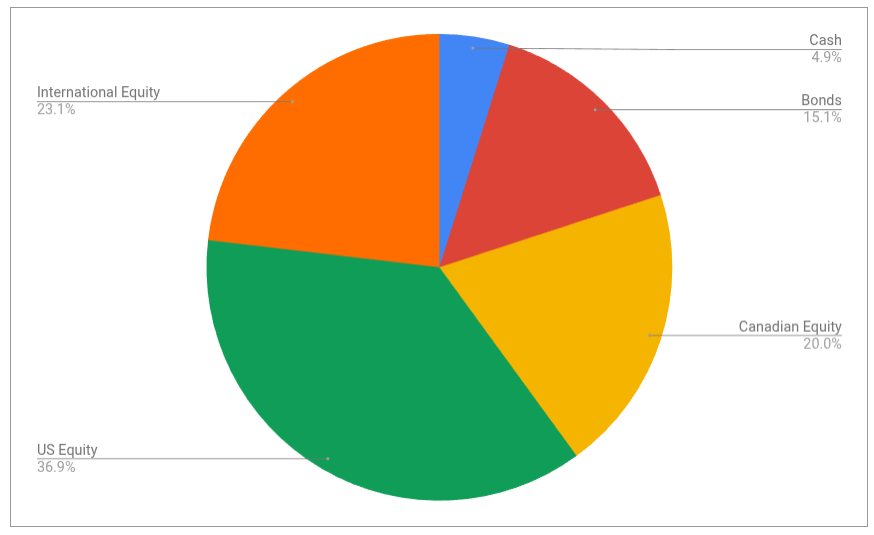
It’s looking pretty close to the targets I have, which are unchanged:
- 5% cash or cash-like holdings like ICSH and ZMMK
- 15% bonds (almost all are buried in XGRO and AOA)
- 20% Canadian equity (mostly based on ETFs that mirror the S&P/TSX 60)
- 36% US equity (dominated by ETFs that mirror the S&P 500, with a small sprinkling of Russell 2000)
- 24% International equity (mostly, but not exclusively, developed markets)
I don’t really see a need to make changes based on what I see here. Cash flowing in to the account (bonus payments, regular TFSA contributions) will be re-invested in one of XEQT or XGRO1, typically2.
Overall
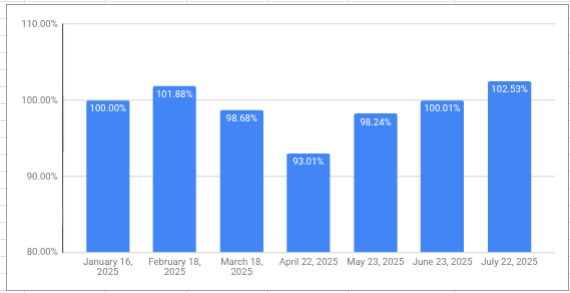
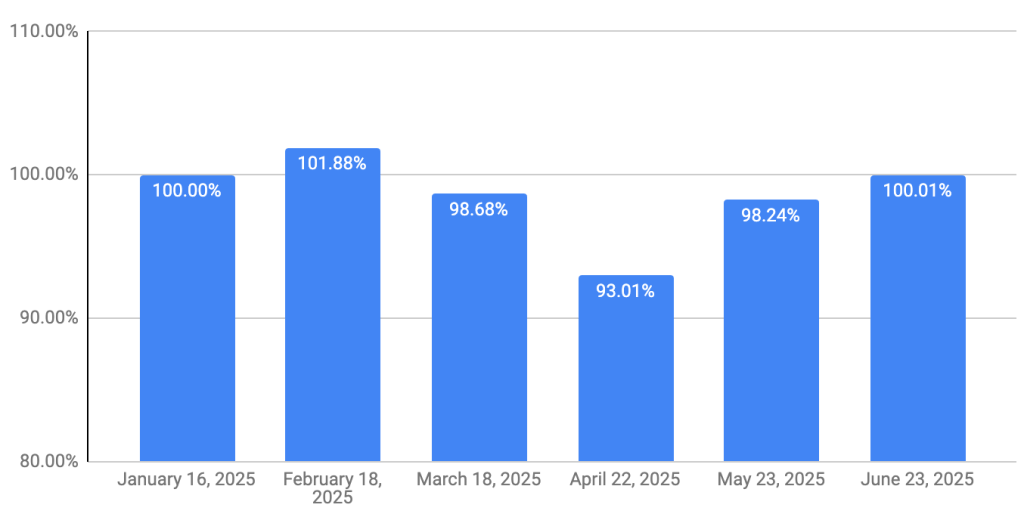
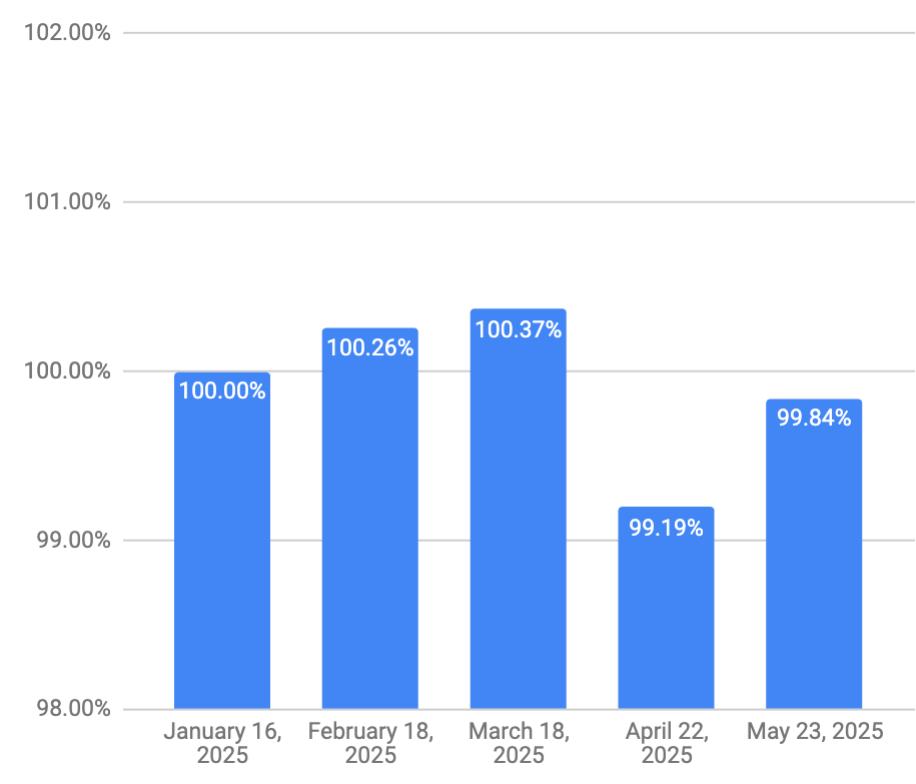
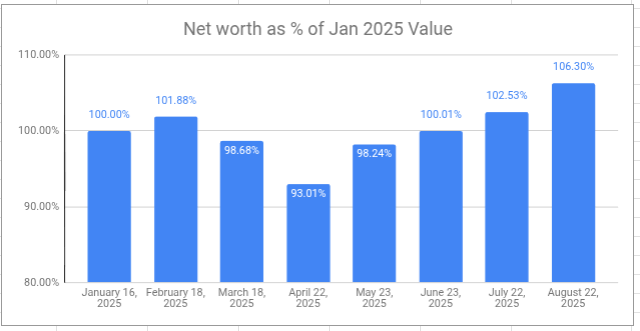
The retirement savings had a great month. Overall, I’m ahead of where I started even though I’ve been drawing a monthly salary since the beginning of the year. This is aligned with what my retirement planner told me to expect, but as you can see, the journey has had some interesting ups and downs already.
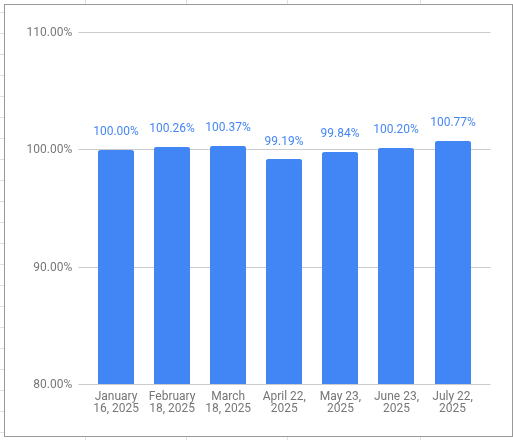
My VPW-calculated salary has hit a new high this year, 2.41% higher than my first draw in January3. This is also expected, since it tracks the value of the retirement portfolio, albeit in a much more controlled way. The VPW “cash cushion” smooths out the ups and downs of the monthly returns. I suppose I really should see an increase in my salary on par with inflation so that I maintain my spending power. I’ll have to think about how to track that4.
- I have purchased some TEQT lately since it has a lower MER. I covered TD’s family of all-in-ones here. ↩︎
- Since my target is 15% bonds, and XGRO is 20% bonds, I have to offset some of the XGRO purchases with 100% equity purchases. ↩︎
- Not a bad raise. ↩︎
- Looks like https://www.statcan.gc.ca/en/subjects-start/prices_and_price_indexes/consumer_price_indexes is a good place to start. ↩︎