Underlying indices of all-in-ones

(New to asset allocation ETFs aka all-in-ones? Here’s a good place to start.)

Asset allocation ETFs can be purchased from any number of companies. In this article, we look at 4 of the biggest names:

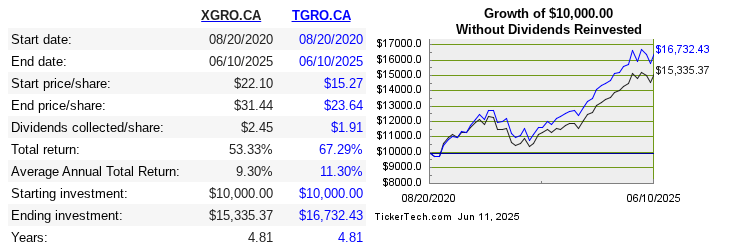
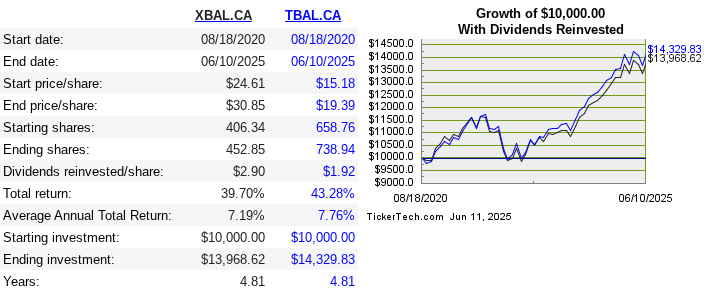
  • TD, with TEQT, TGRO, TBAL et al
  • Blackrock/iShares with XEQT, XGRO, XBAL et al
  • BMO with ZEQT, ZGRO, ZBAL et al
  • Vanguard with VEQT, VGRO, VBAL et al

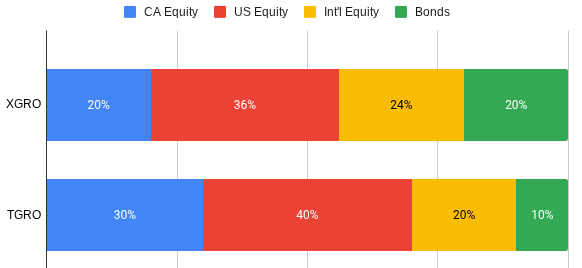
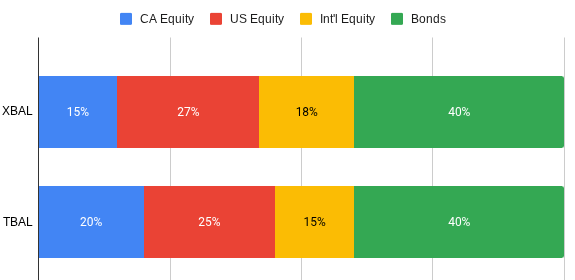
The blueprint for each of these ETFs are similar: pick Canadian, US, International and (where applicable1) bond indices, pick a target percentage allocation for each slice of the pie, and carry on…

I previously talked about the variations in percentage allocation (the size of the pie slices) between the major funds over here.

But what about the indices that each of the major fund families track? What’s in the pie? Are there significant differences? Here’s a summary of what I found:

TD
iSharesBMO Vanguard
TEQT, TGRO, TBALXEQT, XGRO, XBALZEQT, ZGRO, ZBALVEQT, VGRO, VBAL
CAD EquitySolactive Canada Broad MarketS&P/TSX Capped Composite
S&P/TSX Capped Composite
FTSE Canada All-Cap
US EquitySolactive US Large Cap CAD IndexS&P Total MarketS&P 500
S&P Midcap 400
S&P SmallCap 600
CRSP US Total Market
Int’l EquitySolactive GBS Developed Markets ex North America Large & Mid Cap CADMSCI EAFE® Investable Market, MSCI Emerging Markets Investable MarketMSCI EAFE Index, MSCI Emerging Markets IndexFTSE Developed all-cap, FTSE Emerging all-cap
Bonds FTSE Canada Universe Bond IndexFTSE Canada Universe Bond Index and othersFTSE Canada Universe Bond Index and othersBloomberg Global Aggregate Canadian Float Adjusted Bond

So there is variation in the pie recipes (the underlying indices), but is it really of any significance? At a glance, I wonder how different the offerings from iShares and BMO actually are — the same index providers show up in each. Without looking at what stocks are actually found in each of these, here’s a quick take, simply based on the names of the indices:

  • Canadian Equity: All of these funds hold the broad Canadian market, over three different index providers23. iShares and BMO use a capped index, which, in theory, should limit exposure to the very largest Canadian businesses somewhat.
  • US Equity: Three different index providers seen here (Solactive, S&P and CRSP). TD only holds large US companies, the others hold smaller and midsized US companies. In the last ten years, this has been a winning strategy, but it’s not always been that way.
  • International Equity: Three different index providers: Solactive, MSCI, FTSE. TD excludes emerging markets (e.g. Brazil, Russia, Taiwan, China, India). The others don’t.
  • Bonds: Hard to tell just based on the names, but three of them use the same FTSE index. Vanguard uses a Bloomberg index. So I’ll say that it’s likely that Vanguard’s bond portfolio will look different from the other three.

In a future post, I’ll delve into what the main holdings of each of these funds are in each of these categories to see what differences emerge. And whether these differences actually matter!

  1. This excludes 100% equity funds like XEQT, naturally ↩︎
  2. The “composite” in “Capped Composite” means “all the stocks of the TSX”. ↩︎
  3. Solactive, S&P and FTSE ↩︎

TD versus iShares: XEQT/XGRO/XBAL versus TEQT/TGRO/TBAL

My post talking about BMO’s fee reduction for their asset allocation family enticed me to revisit competitive asset allocation funds. TD’s low-low fees (0.17% versus the 0.20% of iShares) are tempting.

So, quick sanity check — what’s the historical performance of XGRO versus TGRO?12

Per https://www.canadastockchannel.com/compound-returns-calculator/ (featured in Tools I Use) I see:

What? The TD fund has returned a full 2 percentage points better? This is a bit hard to believe. They must be rather different somehow?

Ah, yes. Revisiting their respective fund pages reveals that TGRO has a lower allocation for bonds — it’s only 10% versus the 20% for XGRO. More bonds will definitely lower return as a reward for lower volatility (I showed that effect here), so that probably explains the difference.

XGRO versus TGRO: Asset Allocation

So comparing the returns of XGRO versus TGRO wasn’t an apples to apples comparison. I could instead measure the relative returns of XBAL versus TBAL since the equity/bond ratios of these two are equivalent (both at 60% equity, 40% bonds)3. There are, however, some minor differences in the equity side of the equation:

XBAL versus TBAL: Asset Allocation

TBAL has a higher weighting in Canadian equity at the expense of some International equity, let’s see how that translates in the overall return:

That’s a lot closer, but the advantage still tilts TBAL’s way, which is another positive argument for considering it.

I am curious about how different these two are under the hood.

The first obvious difference is that they use different market indexes to build their portfolios, summarized below:

TGRO/TBALXGRO/XBAL
CAD EquitySolactive Canada Broad Market IndexS&P®/TSX® Capped Composite Index
US EquitySolactive US Large Cap CAD IndexS&P Total Market Index
Int’l EquitySolactive GBS Developed Markets ex North America Large & Mid Cap CAD IndexMSCI EAFE® Investable Market Index, MSCI Emerging Markets Investable Market Index
Bonds FTSE Canada Universe Bond IndexFTSE Canada Universe Bond Index and others
Underlying indices tracked by TGRO and XGRO

So sure, the indices are different, but is it really a big deal? Doing a bit of digging I can confidently say that:

  • On the Canadian Equity front, TGRO’s holdings are more broad and include smaller stocks.
  • On the US Equity front, the opposite is true — XGRO holds more smaller US stocks
  • On the International Equity front, XGRO has exposure to Emerging markets that TGRO lacks
  • On the bond front, XGRO includes non-Canadian holdings, so a bit more diversified

Are any of these differences of great significance? No idea. Doubtful. TGRO has a recent small (0.5%) advantage, which is still worth digging in to. I took a look at the underlying assets…It’s easiest to do that by looking at the ETFs that underpin TGRO, one by one (TPU, TTP and TTE). XGRO’s product page shows the underlying assets so you don’t have to do the same (tedious) exercise for it.

Top CAD EquityTop US EquityTop Int’l Equity
TEQT/TGRO/TBALRBC, Shopify, TD, Enbridge, BrookfieldMicrosoft, NVIDIA, Apple, Amazon, MetaSAP, ASML, Nestle, Novo Nordisk, Roche
XEQT/XGRO/XBALRBC, Shopify, TD, Enbridge, BrookfieldMicrosoft, NVIDIA, Apple, Amazon, MetaTaiwan Semi, SAP, ASML, Nestle, Novo Nordisk
Top stock holdings, by asset category, for TGRO and XGRO

Hmph. Almost the same. I guess the difference is really coming down to an advantageous geographic mix for TBAL over XBAL, which may or may not be repeated. As compared to TBAL, XBAL’s greater focus on equities outside North America hurt its performance in the last 5 years.

All this to say that TGRO/TBAL look like fine products, with no real reason not to recommend them. For me, one small complexity with TGRO is its bond allocation, which is lower than XGRO’s, meaning that to keep my usual 20% bond allocation, I would have to either buy a standalone bond fund or buy a TEQT/TBAL combo (a 50/50 ratio works, I did the math).

Perhaps you’ll start to see some of these funds in my monthly update — stay tuned!

  1. I wouldn’t normally do this, especially since the funds don’t have a long history, but in this case I see that the TD funds use obscure (to me) indices so I want to quickly see if there’s a major difference in return. ↩︎
  2. XGRO is the mainstay of the CAD portion of my retirement portfolio and TGRO looks to be the same thing. ↩︎
  3. You may wonder if this is really a valid comparison since what I actually care about is TGRO versus XGRO. I think it is a valid comparison since TBAL and XBAL are still relying on the same underlying indices to build their respective funds, it’s just that the percentages vary. That’s pretty much how most all-in-ones approach the problem of building multiple risk levels: take a set of ingredients (the indicies) and mix them in different ratios to get to the final all-in-one product. It’s really a test to see if TBAL’s indices are somehow “better” than XBAL’s. ↩︎