This is a monthly look at what’s in my retirement portfolio. The original post is here.
Portfolio Construction
The retirement portfolio is spread across a bunch of accounts:
- 5 RRIF accounts
- 3 for me (Questrade, Wealthsimple)
- 2 for my spouse (Questrade)
- 2 TFSA accounts (Questrade)
- 4 non-registered accounts, (1 for me, 1 for my spouse, 2 joint, all at Questrade)
The view post-payday
I pay myself monthly in retirement, so that’s a good trigger to update this post. On March 30, this is what it looks like:
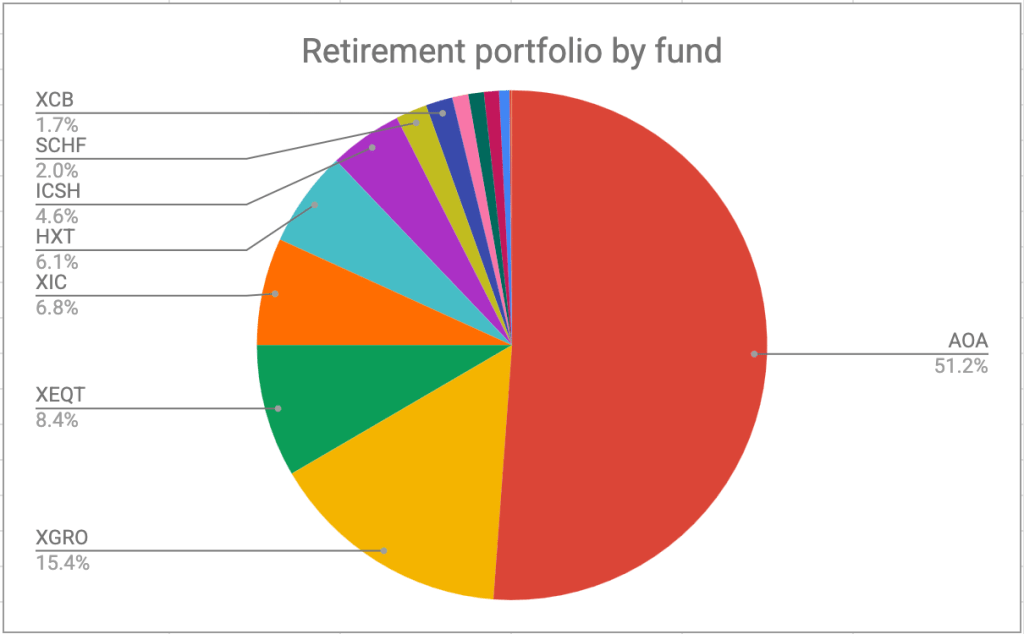
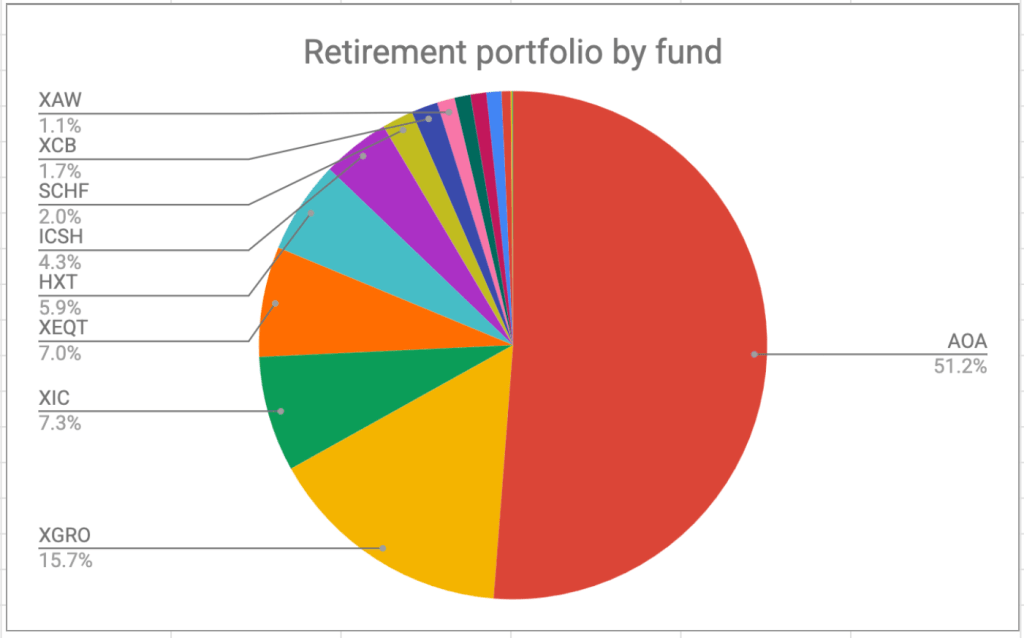
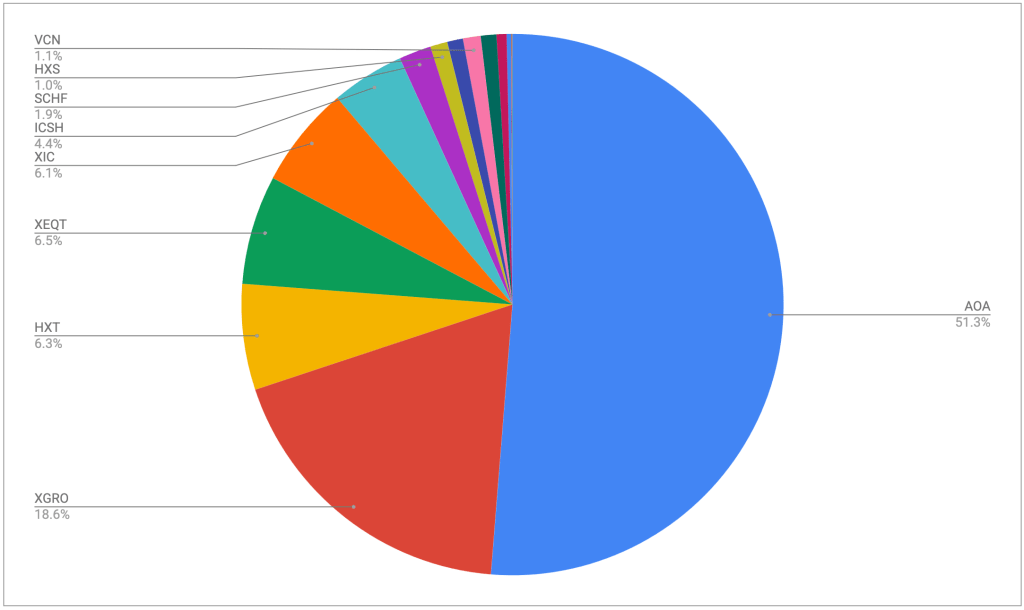
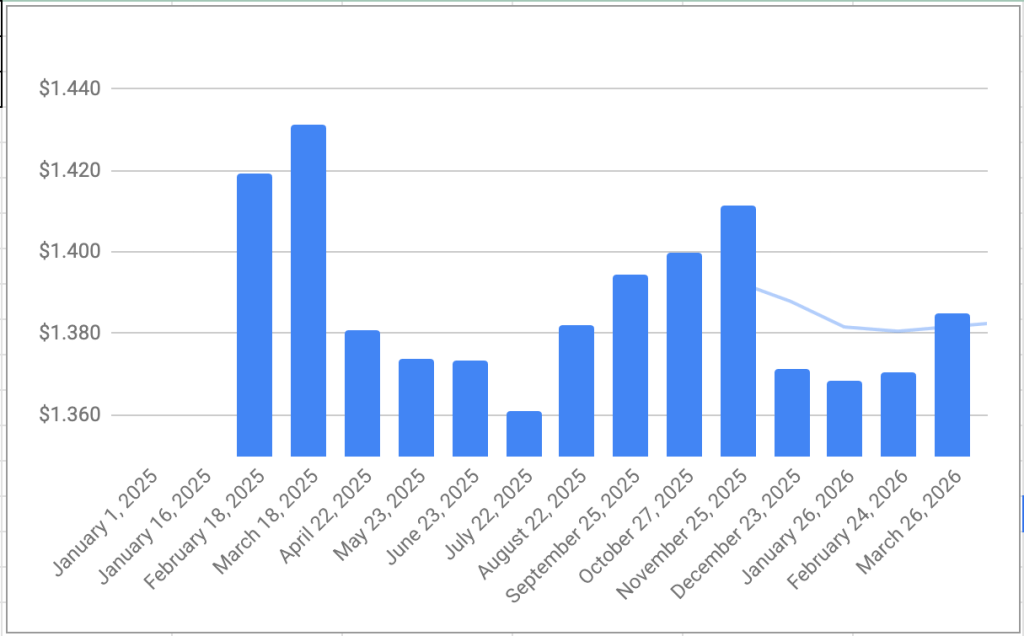
The portfolio is dominated by my ETF all-stars, (and if not an all-star, they are probably on the Magnificent Seven ETFs list). This split is before all the quarterly dividends have paid out. AOA, XGRO, XEQT, XIC all have a quarterly payment that collectively might skew the numbers a bit — I have all these investments on DRIP so I just buy more of the same. All that to say that there weren’t big changes month to month; my USD holdings got a bit of a boost this month thanks to a favourable exchange rate. (A lot of my retirement holdings are in USD, so the FX rates matter somewhat). Here’s what the USD has looked like in CAD since my retirement:
Plan for the next month
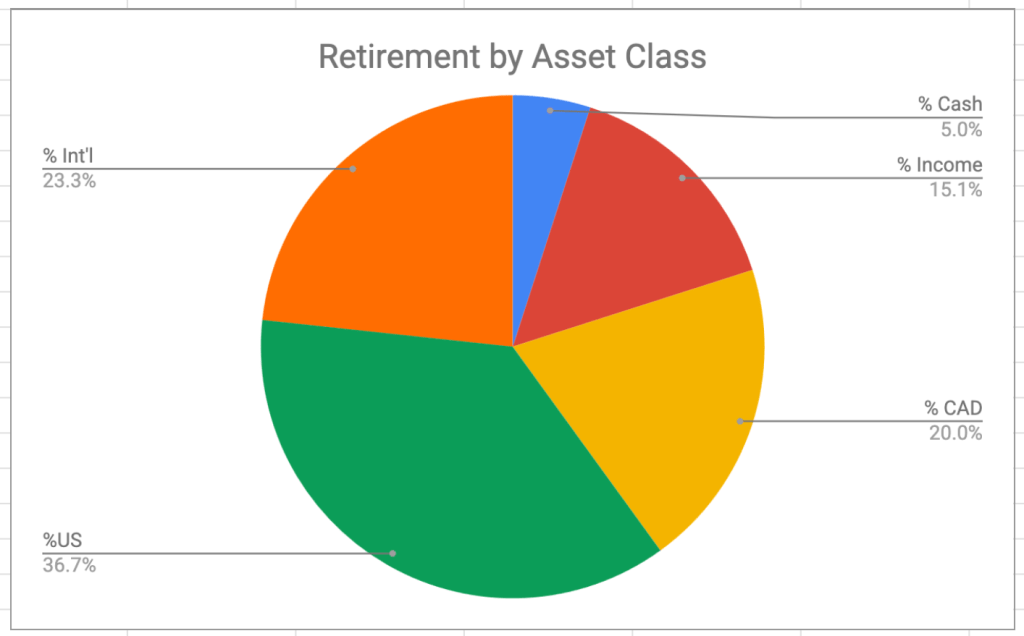
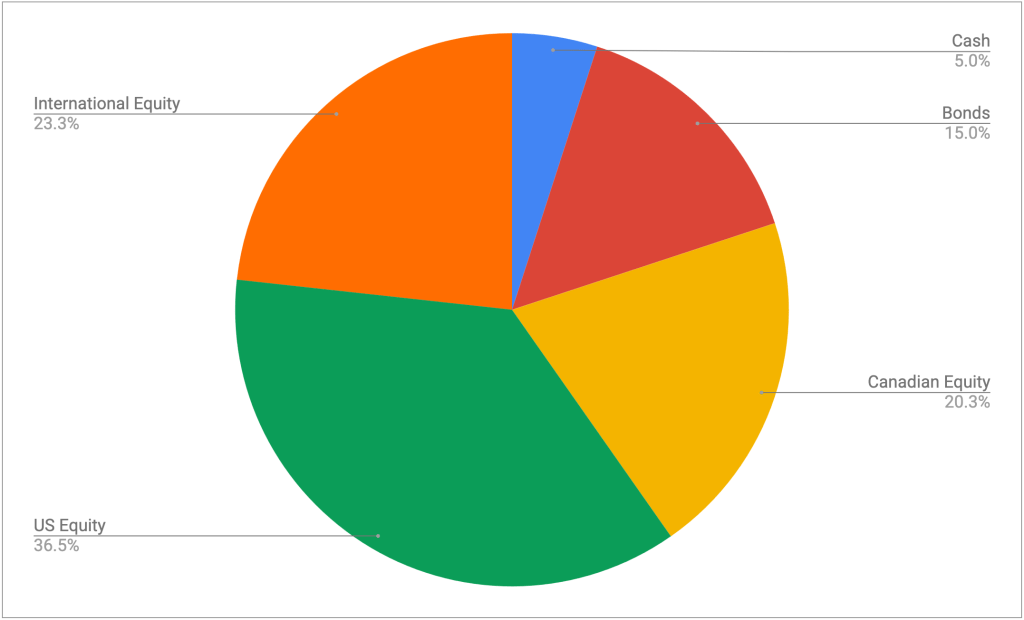
The asset-class split looks like this; you can read about my asset-allocation approach to investing over here.
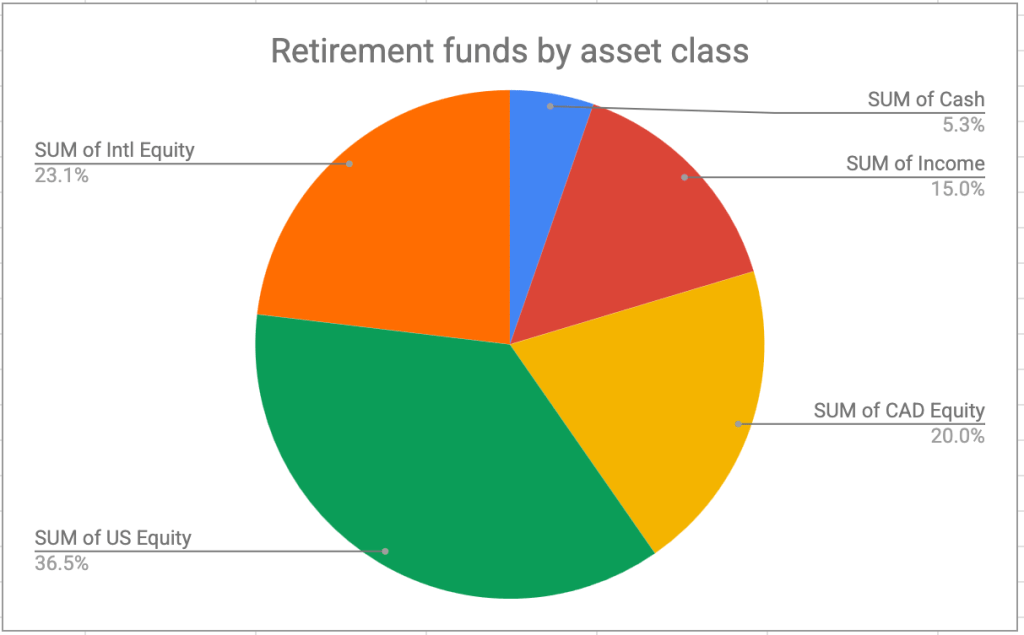
It’s looking pretty close to the targets I have, which are unchanged:
- 5% cash or cash-like holdings like ICSH and ZMMK
- 15% bonds/income (most are buried in XGRO and AOA, rest are in XCB)
- 20% Canadian equity (mostly based on ETFs that mirror the S&P/TSX — HXT and XIC)
- 36% US equity (dominated by ETFs that mirror the S&P 500)
- 24% International equity (mostly, but not exclusively, developed markets)
The alignment with target is what drives my investment decisions; seeing the chart above tells me there’s no movements needed, which makes things simpler.
Since we’re just about in to the 2nd quarter of the year, it’s time for me to move some AOA into XGRO using Norbert’s Gambit1. The Gambit has worked out pretty well for me so far; I track my effective FX rate every time I do it, and it’s always less than relying on the instant (and relatively expensive) FX conversions offered by my broker2.
Overall
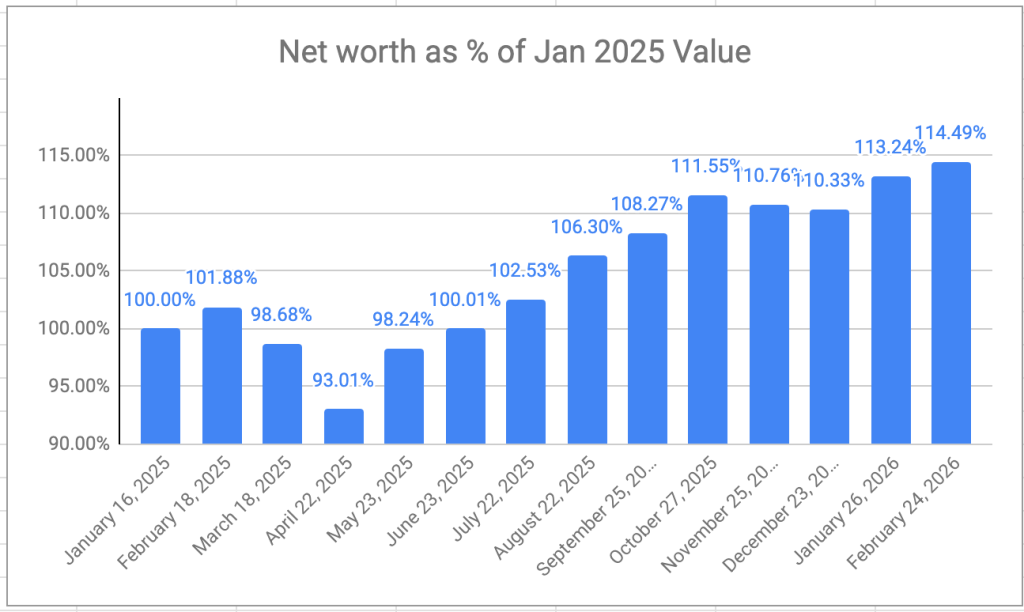
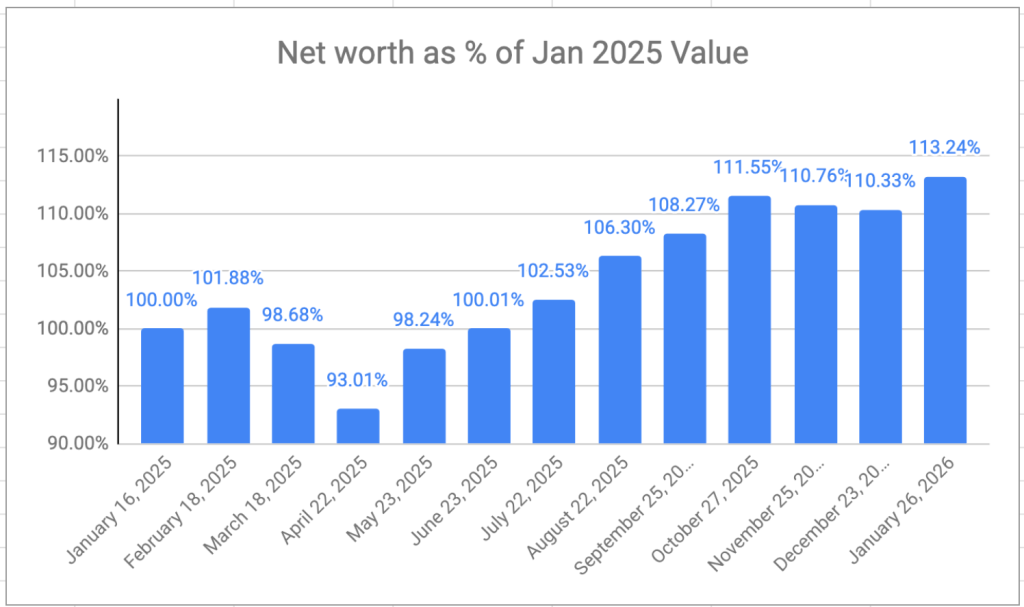
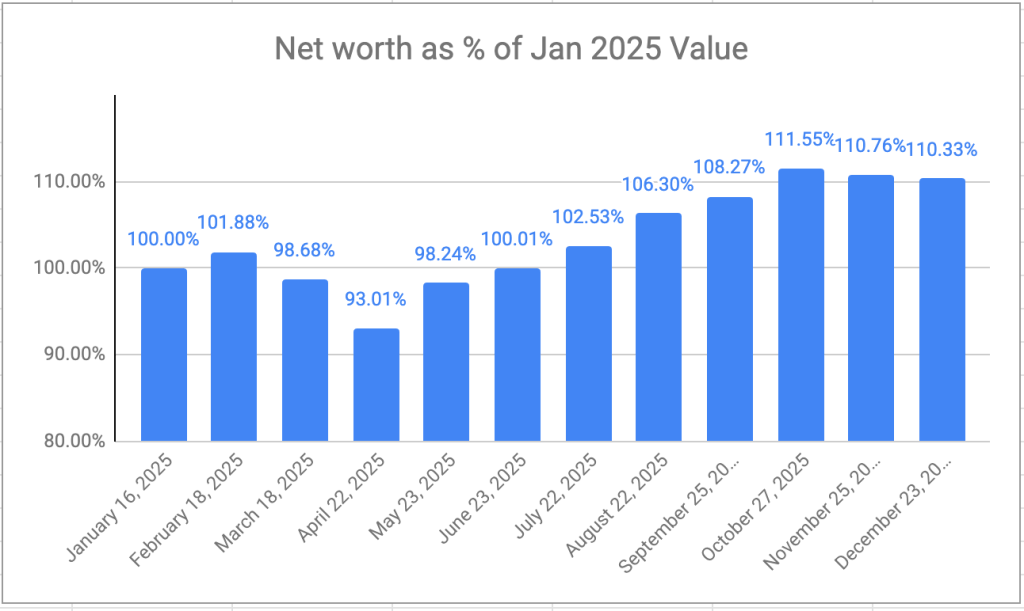
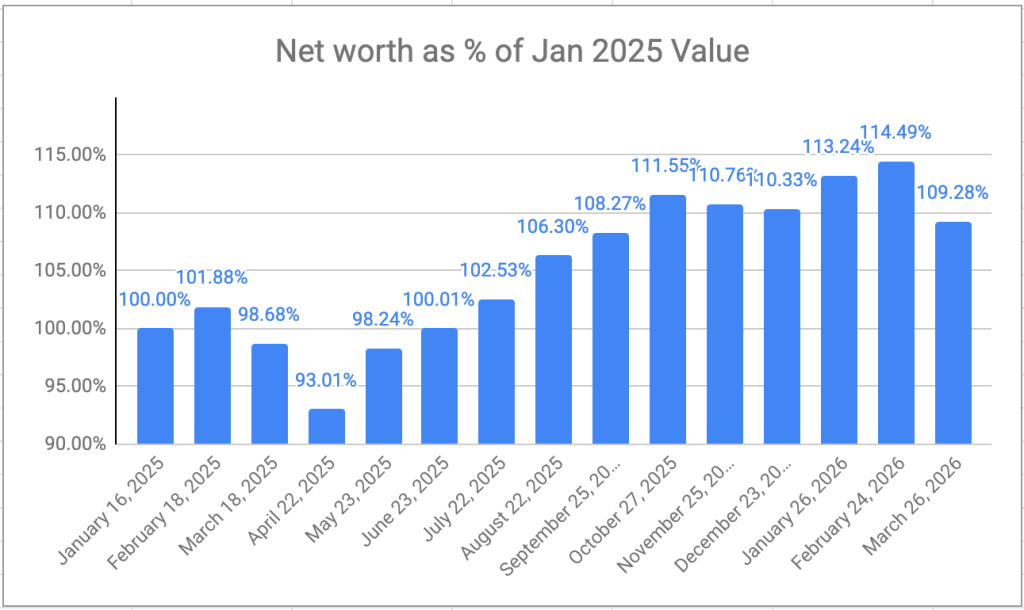
Part of using VPW3 as a strategy is the need to calculate your retirement net worth on a monthly basis. As you can see below, the most recent market gyrations have had a bit of an impact on the bottom line, taking me back to a value I haven’t seen since September last year:
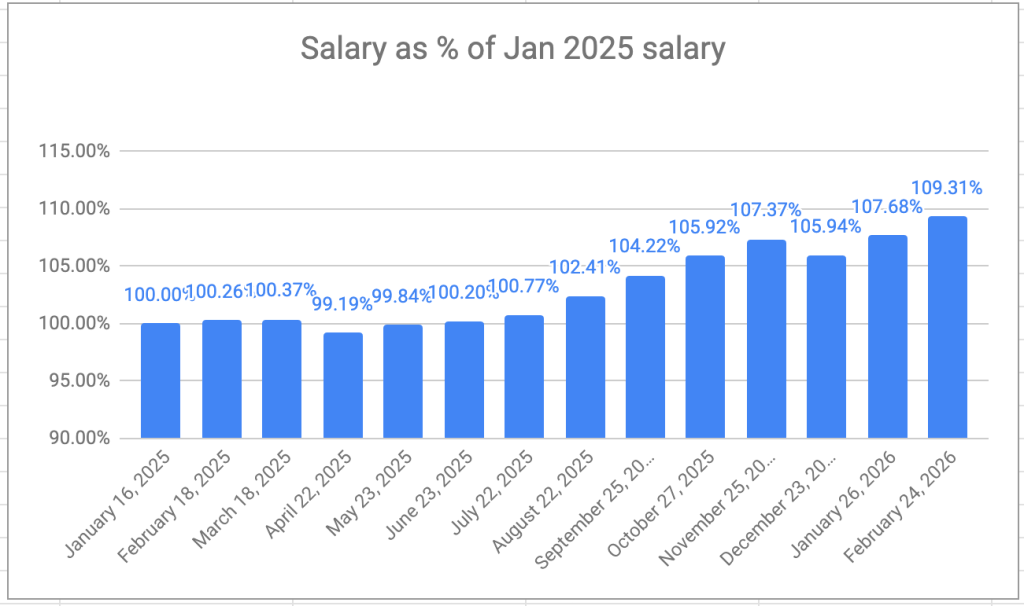
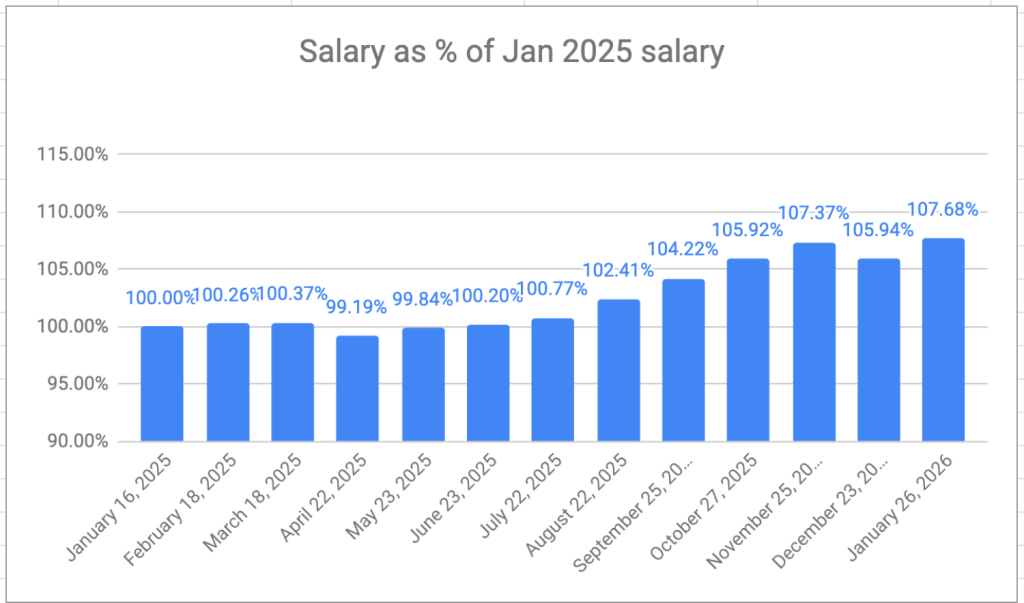
But my VPW-calculated salary, which has a built in shock absorber (aka cash cushion), continued its upward trend nonetheless:
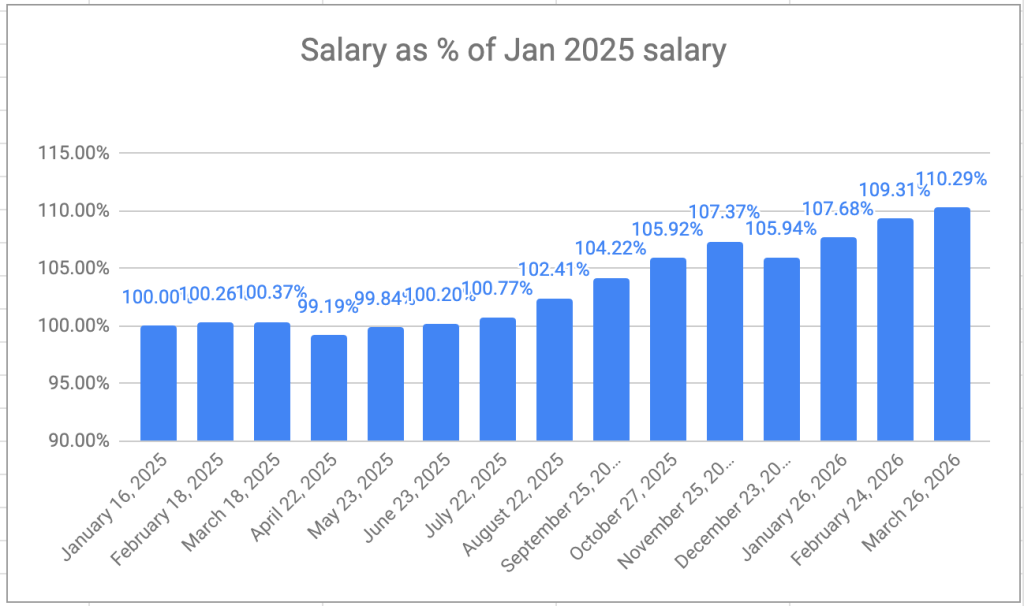
I’m expecting to take a pay cut at some point if the markets fail to recover, but pay cuts are an expected outcome of using VPW as a strategy. The “V” is for “variable”, after all. At this point, I’m still taking over 10% more than I did a year ago, so no matter how you slice it, things are more than on track.