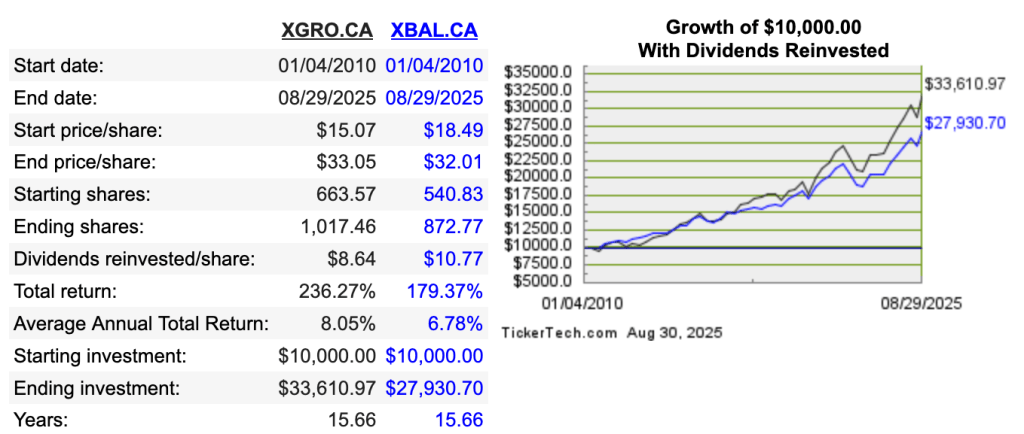
ZGRO and ZGRO.T are both asset allocation funds (aka all-in-ones1) offered by BMO. They hold the same assets, and they both generate the same (dividends-reinvested) returns. But ZGRO.T says it has a yield of 5.65% whereas ZGRO has a yield of 1.73%2. How is this possible? Full disclosure: I don’t own either of these funds because I have historically invested in a very similar-to-ZGRO product, XGRO, instead3.
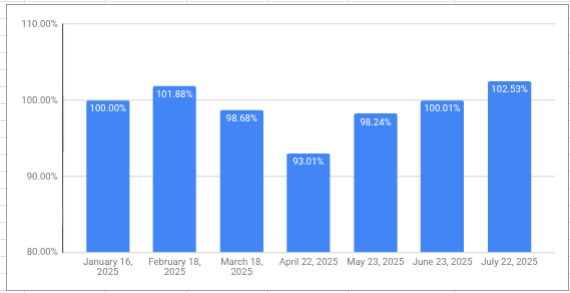
Let’s start with a really high level look at these funds4.

The first thing I’ll point out is one of caution: ZGRO and ZGRO.T have very similar tickers and it’s all-too-easy to mix them up. The fund names are also very similar, although ZGRO.T adds the words “Fixed Percentage Distribution Units” to the mix. That’s a clue. The other things we can learn from this first glance is that ZGRO.T is pretty new (Inception Date), is about 1/20th the size of ZGRO in terms of investments (Net Assets), has an identical MER to ZGRO, but whoa, that distribution yield is off the charts. Put simply, if you had $1000 in ZGRO, and $1000 in ZGRO.T, and the last distribution paid was assumed to be constant5, you’d get $11.73 from ZGRO and $56.50 from ZGRO.T over the next twelve months. Huh?
This is even more puzzling if one takes a look at what each of the two ETFs hold: it’s identical:
| ETF Held | ZGRO %6 | ZGRO.T % |
|---|---|---|
| ZSP – S&P 500 | 37.0 | 37.0 |
| ZCN – TSX Capped | 20.4 | 20.4 |
| ZAG – CAD Bond | 13.8 | 13.8 |
| ZEA – MSCI EAFE | 13.4 | 13.4 |
| ZEM – MSCI Emerg | 6.7 | 6.7 |
| ZUAG – US Bond | 5.8 | 5.8 |
| ZMID – US Mid Cap | 2.0 | 2.0 |
| ZSML – US Small Cap | 1.0 | 1.0 |
| Cash | 0 | 0 |
Comparing top holdings, ZGRO versus ZGRO.T. Can you see a difference? I can’t see a difference.
I spent quite a bit of time searching on the BMO website trying to get their take on the difference. In a lot of places, (e.g. the simplified prospectus7), the two funds are treated as the same. After nearly giving up, I did come across this document which has a teeny tiny footnote, which I reproduce here:
These units are Fixed Percentage Distribution Units that provide a fixed monthly distribution based on an annual distribution rate. Distributions may be comprised of net income, net realized capital gains and/or a return of capital. The monthly amount is determined by applying the annual distribution rate to the T Series Fund’s unit price at the end of the previous calendar year, arriving at an annual amount per unit for the coming year. This annual amount is then divided into 12 equal distributions, which are paid each month.
BMO Asset Allocation ETFs Whitepaper
So the big difference as I see is is that ZGRO.T attempts to give a stable yield in 12 month chunks. It does this by
- Giving you dividends from the underlying assets (so does ZGRO)
- Selling underlying assets (and generating a capital gain)
- Giving you back your own money (this is known as as return of capital)
Let’s take a look at the two from a tax perspective (note that this only matters if you were to hold these funds in a non-registered account):

And here the distinction between the two becomes clearer: ZGRO.T is making good use of Return of Capital (RoC) to distribute a dividend with limited near-term tax implications. But as always, there’s no free lunch — using RoC means that future capital gains will be higher since RoC reduces the ACB8 of the funds in question, and if your ACB drops to zero, you have to treat RoC as a capital gain.
So when might you consider using ZGRO.T instead of ZGRO?
ZGRO.T makes sense in a RRIF account. It’s essentially automating some of the steps I have to take every month to get paid (you can see the mechanism I use here). Every month, I have to sell some of my holdings in order to get the RRIF-minimum payment out.
In a non-registered account, ZGRO.T’s monthly distributions might be useful if you had the need for consistent monthly cash flow; in addition, if you expect to at some point be in a lower tax bracket, it might help you save future tax, since it’s deferring some gains by using Return of Capital. In my case, I don’t see a good reason to use it since I would have to sell existing assets in order to raise funds to buy it, which generates capital gains.
So, in summary, the two funds are the same from a total return perspective, with ZGRO.T more monthly cash and ZGRO providing more paper gains. In a RRIF account, ZGRO.T automates some of the manual selling needed to execute decumulation. In a non-registered account, the tax treatment of the two is different, and you’d have to work out the numbers to see if it’s a benefit or not.
- If you want to read about all-in-ones, https://moneyengineer.ca/2025/01/21/why-you-can-fire-your-advisor-asset-allocation-etfs/ is a good place to start. ↩︎
- This yield is calculated by dividing the most recent per share distribution by the share price and multiplying by 12. In essence, this number is the value of the most recent (monthly in the case of ZGRO.T, quarterly in the case of ZGRO) dividend payout extrapolated over the full year. It may or may not represent what kind of yield you get in the future. ↩︎
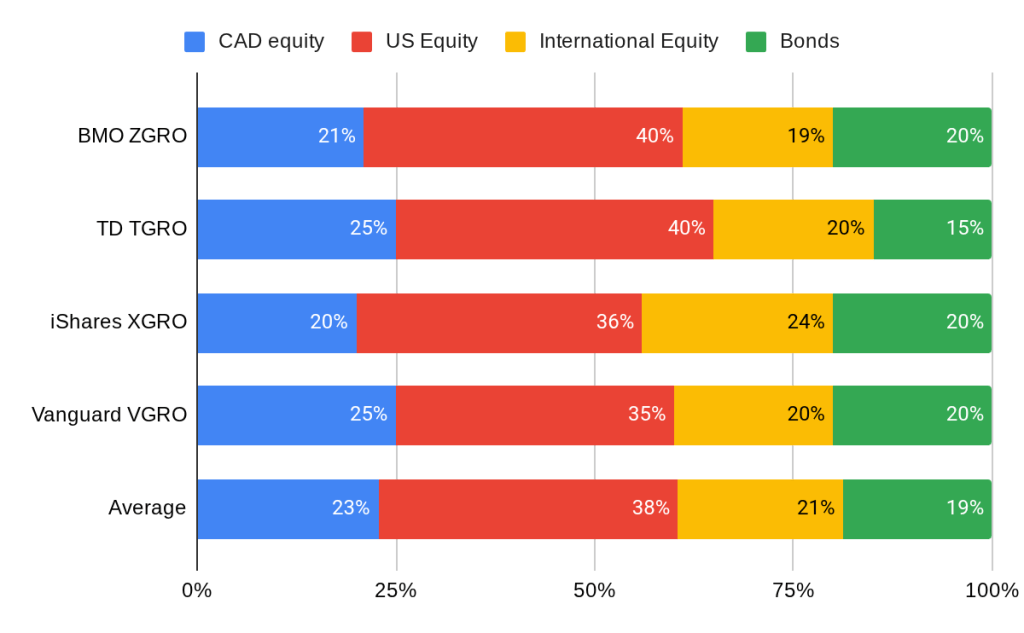
- Why? Inertia. There are minor differences in the makeup of XGRO versus ZGRO but either is a fine choice for the lazy investor. ↩︎
- All the tables here are right off BMO’s ETF selector, which is excellent, by the way. ↩︎
- ZGRO is currently paying 7.3 cents per share every quarter and this has been stable since 2020. ZGRO.T is currently paying 6 cents per unit held every month and this has been stable since March 2025. ↩︎
- As of September 18, 2025 ↩︎
- which weighs in at ~450 pages. I’d hate to see the non-simplified prospectus. ↩︎
- Adjusted Cost Base. The average per unit price you pay for a share, necessary to track in order to accurately calculate capital gains (or losses). I use adjustedcostbase.ca for this, found in Tools I Use ↩︎