This is a (hopefully1 monthly) look at what’s in my retirement portfolio. The original post is here. Last month’s is here.
Portfolio Construction
The retirement portfolio is spread across a bunch of accounts2:
- 7 RRIF accounts (3 for me, 3 for my spouse, 1 at an alternative provider as a test)
- 2 TFSA accounts
- 4 non-registered accounts, (1 for me, 1 for my spouse, 2 joint)
The target for the overall portfolio is unchanged:
- 80% equity, spread across Canadian, US and global markets for maximum diversification
- 15% Bond funds, from a variety of Canadian, US and global markets
- 5% cash, held in savings-like ETFs.
You can read about my asset-allocation approach to investing over here.
The view as of this morning
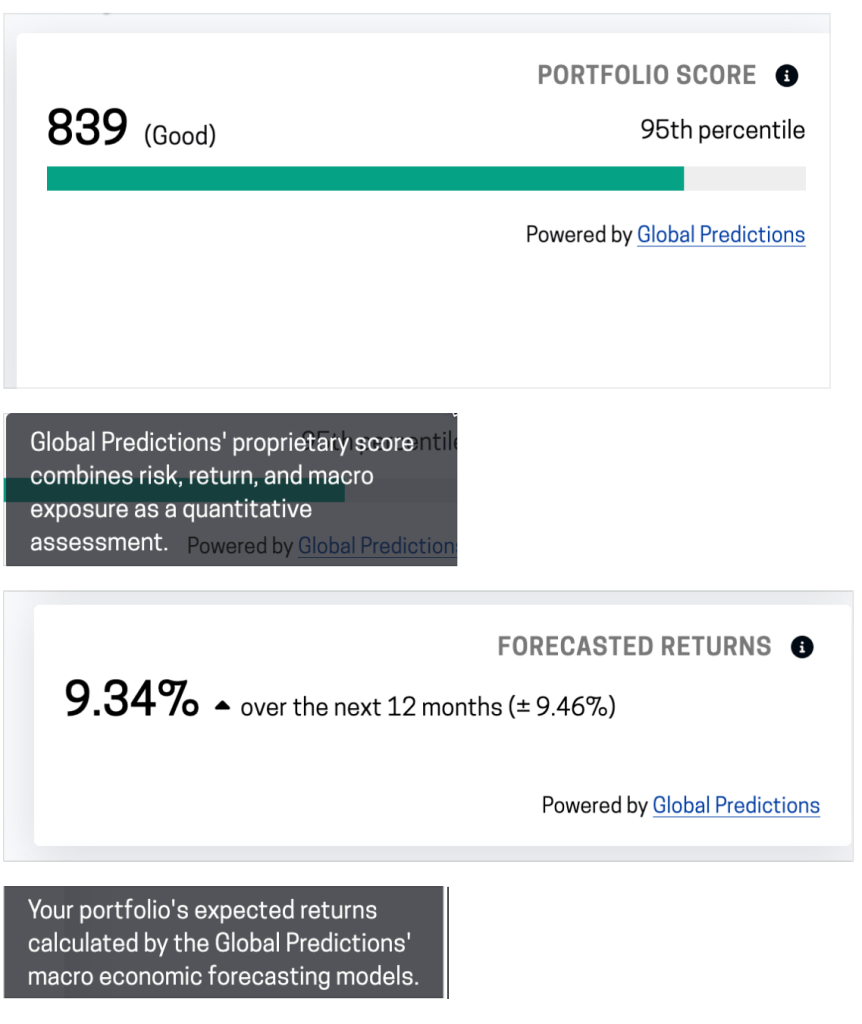
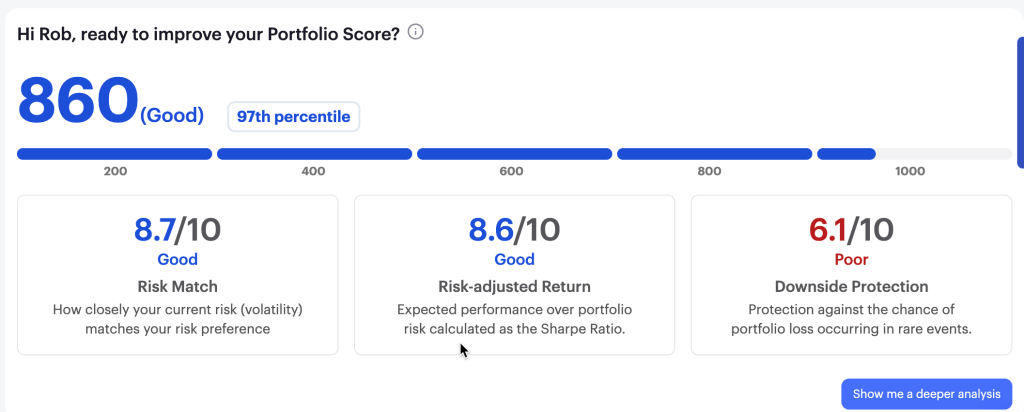
As of this morning, this is what the overall portfolio looks like:
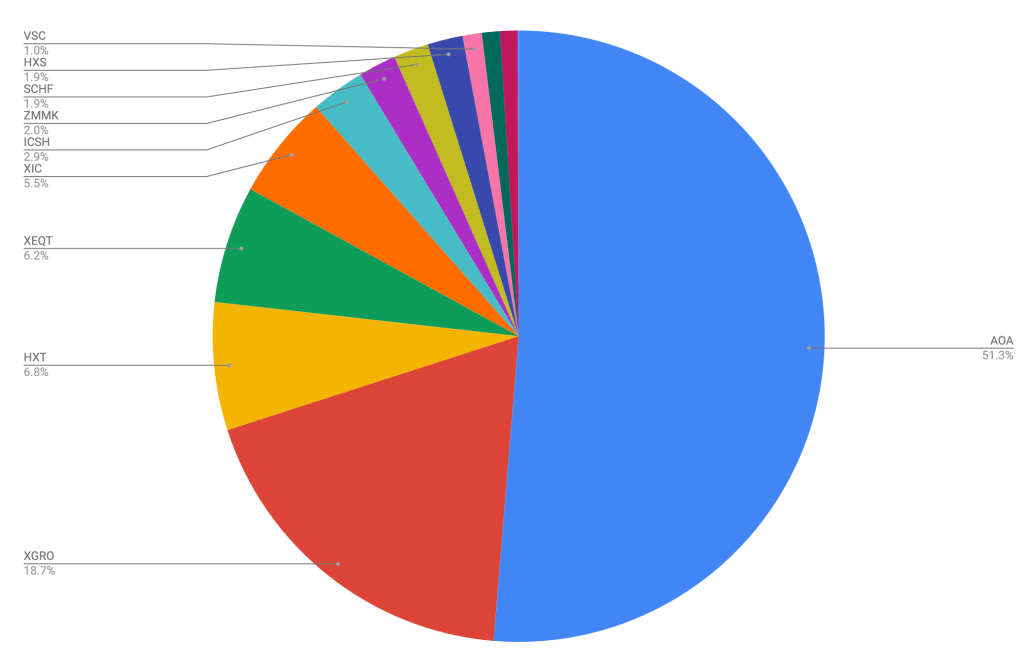
The portfolio is dominated by my ETF all-stars; anything not on that page is held in a non-registered account and won’t be fiddled with unless it’s part of my monthly decumulation. Otherwise I’ll rack up capital gains for no real benefit.
The biggest changes over the last 30 days was due to a small rebalancing exercise I executed. I sold off some AOA in order to pick up more ICSH. The stock market has been roaring lately, and it caused my target allocations to become a bit cash-poor; ICSH is not, strictly speaking, “cash”, but for my purposes, it’s close enough. (You can read about my cash thoughts here). I could have instead sold XGRO to pick up more ZMMK, but US interest rates are a lot better than Canadian ones at the moment, so I figured I’d enjoy the extra few percentage points of return on my cash holdings.
Plan for the next month
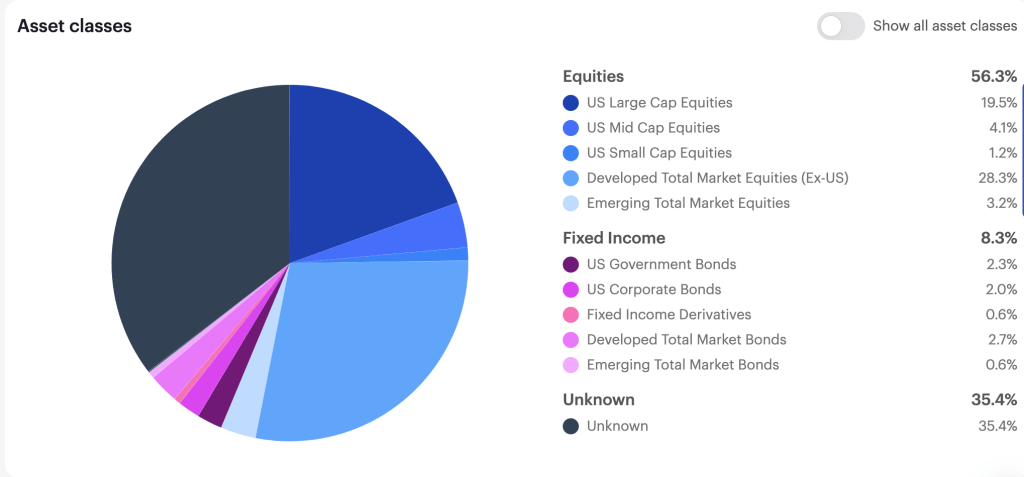
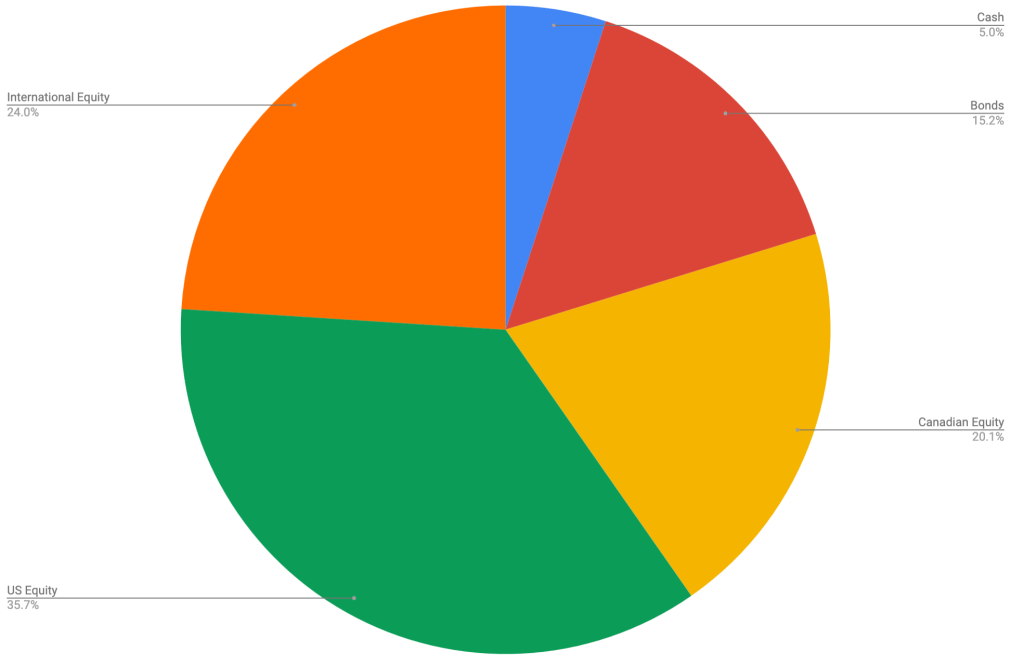
The asset-class split looks like this
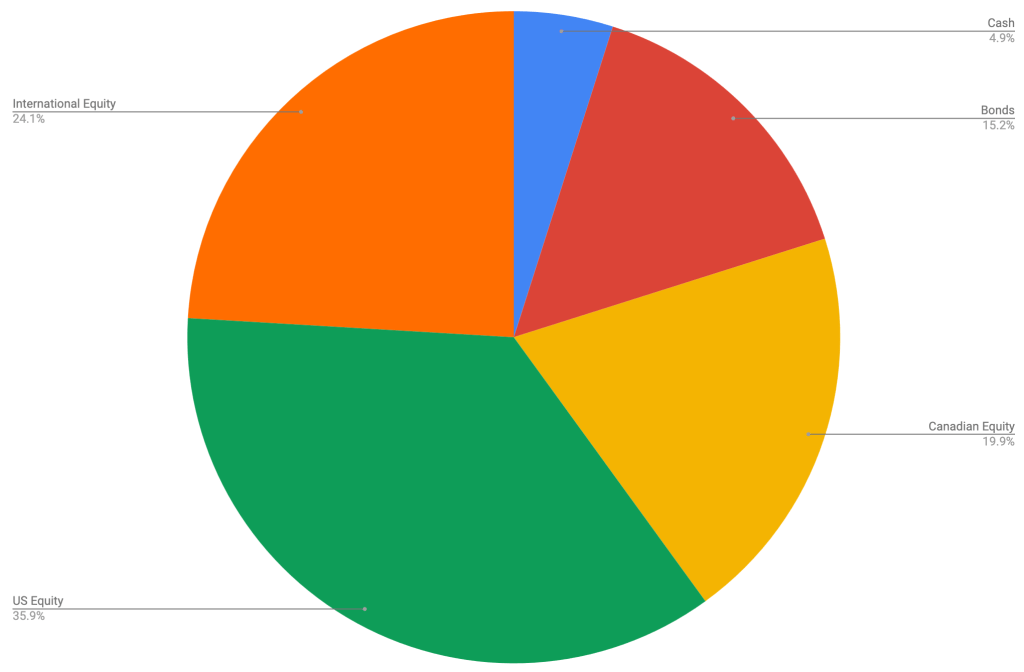
This looks to be pretty close to my target percentages which haven’t changed:
- 5% cash or cash-like holdings like ICSH and ZMMK
- 15% bonds (almost all are buried in XGRO and AOA)
- 20% Canadian equity (mostly based on ETFs that mirror the S&P/TSX 60)
- 36% US equity (dominated by ETFs that mirror the S&P 500, with a small sprinkling of Russell 2000)
- 24% International equity (mostly, but not exclusively, developed markets)
The pie is looking almost perfect at the moment. I don’t see any near-term need for fiddling with what’s there.
Overall
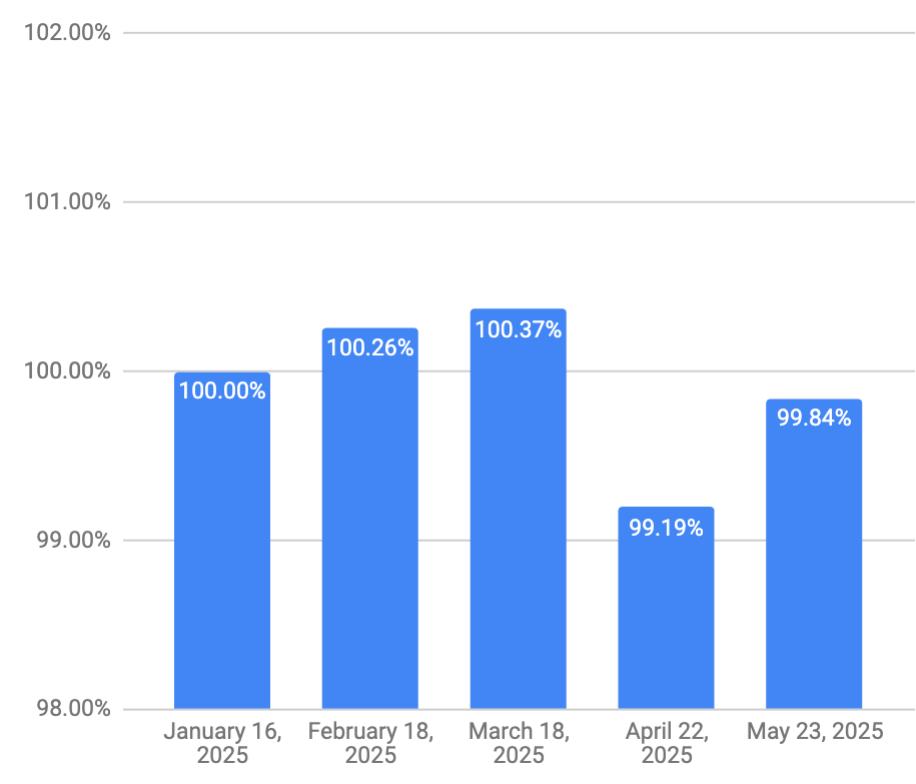
The retirement savings look quite healthy; even though I’ve been drawing a monthly salary for 6 months, I’m now ahead of where I was3 when I started my retirement journey. This is aligned with what my retirement planner told me to expect, but as you can see, the journey has had some interesting ups and downs aready.
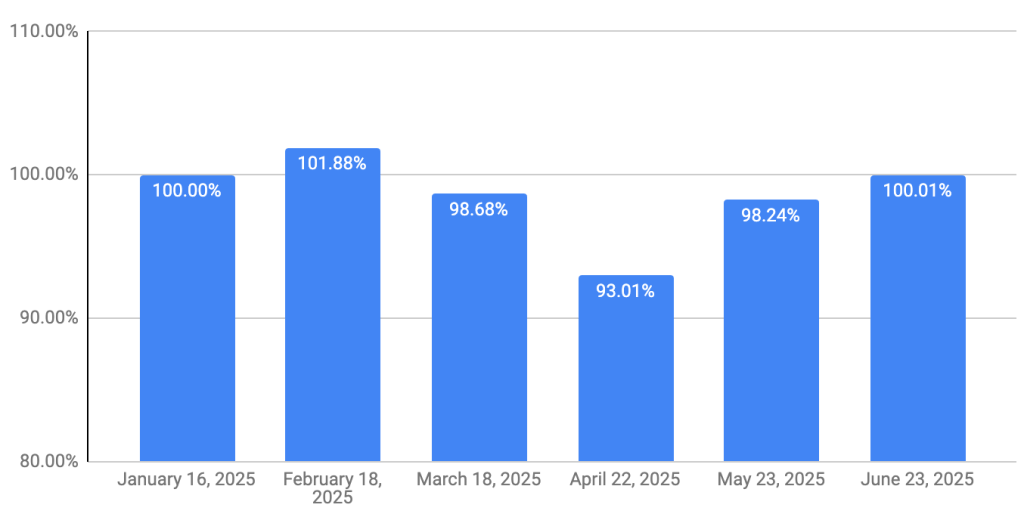
My VPW-calculated salary has gone back to more or less where I started at the beginning of the year. And even with the crazy market swings we’ve seen, it’s stayed remarkably stable4. That’s thanks to the built-in shock-absorber of the VPW model (a 6-month cash cushion which smooths out the market gyrations considerably). I also think it’s an endorsement of my choice to take retirement payments monthly; my exposure to short-term market hiccups is greatly reduced since I’m not making big sales of ETFs to fund a year of spending all at once.