Summary: Vanguard asset allocation funds aka all-in-one funds VEQT, VGRO, VBAL, VCNS. VSIP have reduced their management fees to 0.17%, down from 0.22%, effective November 18, 2025.
It’s a good time to be an all-in-one investor, as I am. New to all-in-ones? Read all about them here.
The summary pretty much says it all. It just got cheaper to own Vanguard’s all-in-one funds. The amount of the reduction amounts to 50 cents for every $10001 invested per year, but compounded over many years, and multiplied by however much you have saved for retirement, it can be a surprisingly large number.
All-in-ones are much cheaper than either roboadvisors or your typical financial advisor, but as we studied before, they’re not without some cost, so fee reductions are always welcomed. Vanguard joins TD and BMO in reducing the cost of their all-in-ones. We looked at the makeup of each of these funds lately; there’s not a huge amount of difference, no matter which one you pick.
Anyway, you may note that Blackrock’s XEQT/XGRO/XINC family is now the most expensive of the lot; there’s no reason for that to be true given the competitive landscape. I would expect Blackrock to follow suit, or if not, I’ll probably be making some moves to get to lower fees, since a lot of my retirement portfolio is currently tied up in XEQT/XGRO. ZEQT/ZGRO I think is the closest in makeup to the XEQT/XGRO family.
Of course, if you only have $1000 saved for retirement, you have other worries. ↩︎
In a previous post, I took a look at the major fund companies’ all-in-one-funds with a focus on what passive indices each of them folllowed with regards to Canadian equity, US equity, International equity, and bonds. That assessment found that iShares and BMO were very similar, but TD and Vanguard looked very different.
But do different indices really make a difference in terms of what each of these companies hold when it comes to equities? That’s what we’re trying to find out. Let’s take a look at each of the categories in turn.
Canadian Equity
Let’s take a look at the top Canadian equity holdings of TEQT, XEQT, ZEQT and VEQT1:
Stock
TEQT %
XEQT %
ZEQT%
VEQT%
RBC
1.65
1.73
1.62
1.80
Shopify
1.55
1.69
1.62
1.49
TD
1.12
1.16
1.10
1.16
Enbridge
0.84
0.88
0.85
0.92
Brookfield
0.82
0.82
0.78
0.81
BMO
0.74
0.77
0.72
0.77
Agnico
0.66
0.69
0.68
0.63
Scotiabank
0.64
0.67
0.63
0.68
CIBC
0.60
0.63
0.60
0.63
CP KC
0.57
0.58
0.57
0.62
# held
292
215
215
156
Top 10 %
9.19
9.62
9.17
9.51
Top Canadian Equity Holdings for TEQT, XEQT, ZEQT, VEQT per ETF factsheets, October 2025
VEQT has fewer holdings than the others, and this indicates slightly more concentration/slightly less diversification than the other funds. TEQT is at the top of the heap when it comes to the number of companies held, with XEQT and ZEQT looking pretty similar. My take here is that the differences between TEQT/XEQT/ZEQT/VEQT are pretty slight when it comes to Canadian equity. The Canadian equity indices these funds track may be different, but the differences are pretty minor, and might simply be attributable to tracking errors; how often and when these funds rebalance their holdings may explain the differences shown here.
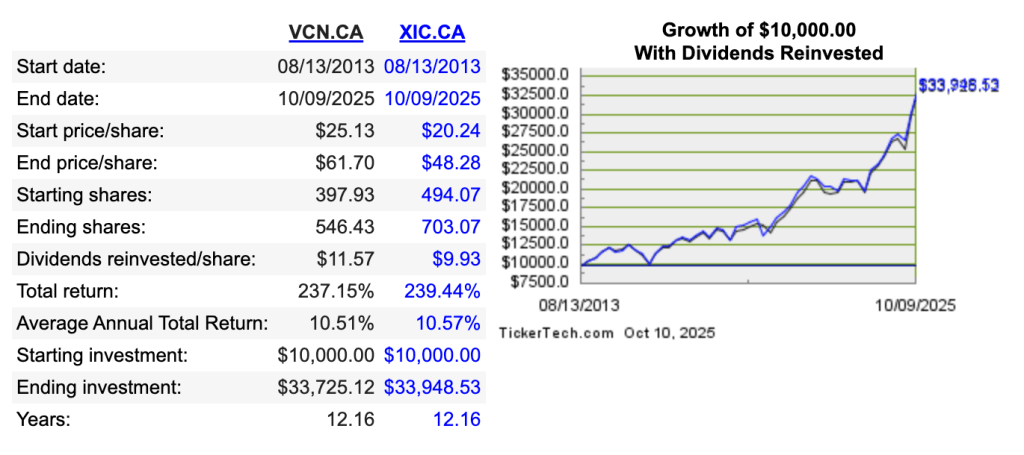
But just for fun, I looked at comparing VCN (which is underneath VEQT, and tracks the FTSE Canada all cap) to XIC (which is underneath XEQT, and tracks the S&P/TSX Capped Composite) and found this using https://www.dividendchannel.com/drip-returns-calculator/ (which is also listed in Tools I Use).
This indicates a tiny advantage to XIC aka the capped composite index, but there’s not a lot of daylight between these two returns!
On the Canadian Equity front, I declare the 4 funds EQUIVALENT!
US Equity
The US weighting is NOT the same for each of these funds, so making a one-to-one comparison is a bit tricky.
TEQT: 55% US
ZEQT: 50% US
XEQT, VEQT: 45% US
What I show in the table below is the percentage of the US portion held by the fund. So in other words if stock XYZ makes up 5% of the US holdings of TEQT and XEQT, it means that TEQT actually holds more of XYZ because 55 cents of every dollar of TEQT is invested in XYZ as compared to 45 cents for XEQT et al.
Stock
TEQT: TPU %
XEQT: XTOT %
ZEQT: ZSP/ZMID/ZSML%
VEQT: VUS%
NVIDIA
7.81
6.91
7.35
6.45
Microsoft
6.62
5.71
6.26
6.02
Apple
6.38
5.53
5.99
5.54
Amazon
3.73
3.24
3.45
3.49
Broadcom
2.75
2.38
2.51
2.23
Meta
2.74
2.33
2.51
2.56
Alphabet Cl A
2.43
2.07
2.26
1.97
Alphabet Cl C
2.13
1.67
1.82
1.59
Tesla
2.12
1.80
1.91
1.46
JP Morgan
1.46
1.24
1.36
1.29
Eli Lilly
1.25
1.00
1.09
1.00
Berkshire
1.15
1.33
1.47
1.43
# held
504
2494
1511
3524
Top 10 %
38.17
32.97
35.54
32.74
Top US Equity Holdings for TEQT, XEQT, ZEQT, VEQT per ETF factsheets, October 2025
What’s clear here is that TEQT is an outlier insofar as it only focuses on the largest US companies, with the other three funds including smaller companies. This also impacts how much money is found in the top 10 US holdings of TEQT, with 38% of holdings invested in names like NVIDIA, Microsoft, Apple et al.
This has proven beneficial of late since smaller US companies have not kept pace with the larger ones. Per spglobal.com, the 10 year performance as of Oct 13, 2025 of the three US market segments has been:
S&P SmallCap 600 = 7.65%
S&P MidCap 400 = 8.49%
S&P 500 = 12.75%
Meaning that any fund that holds smallcap and midcap US stocks has had their returns dragged down in the past 10 years.
So my conclusion for US Equities is that TEQT is the performance champion, but this comes with a less diversification than the alternatives: not only does TEQT focus on the highest-performing portion of the US equity market, it also puts more money overall into the US equity market. This has worked well for the last ten years, but it’s anybody’s guess as to whether this is a good idea for the future.
International Equity
The International2 weighting is NOT the same for each of these funds, so making a one-to-one comparison is a bit tricky.
TEQT: 20% International
VEQT: 25% International
ZEQT: 25% International
XEQT: 30% International
BMO gets the “lack of transparency” award from me for their complex structure. ZEQT holds ZEA which holds European stocks as well as IEFA, which is their USD fund holding the same things. It also holds ZEM which holds emerging markets stocks as well as EEM, which holds similar things in USD. Nowhere can you find a BMO/ZEQT consolidated view like what I’m showing below.
Like in the previous examples, what I show in the table below is the percentage of the International portion held by the fund.
Stock
TEQT: TPE %
XEQT: XEF/XEC %
ZEQT: ZEA/IEFA/ZEM/EEM%
VEQT: VIU/VEE%
Taiwan Semi
0
1.73
5.88
4.19
ASML
1.98
1.43
2.11
1.59
SAP
1.43
1.03
1.37
1.14
Nestle
1.30
0.93
1.24
0.96
Roche
1.24
0.87
1.12
0.95
Novartis
1.24
0.90
1.17
0.98
AstraZeneca
1.24
0.93
1.26
0.94
HSBC
1.15
0.83
1.22
1.02
Shell
1.11
0.80
1.09
0.87
Toyota
1.06
0.70
0.97
0.85
Siemens
1.02
0.77
1.08
0.82
Tencent
0
0.80
2.75
2.10
Samsung
0
0.37
2.03
1.16
Alibaba
0
0.40
1.87
1.59
# held
893
5626
3864
3524
Top 10 %
12.77
10.25
20.89
15.68
Top International Equity Holdings for TEQT, XEQT, ZEQT3, VEQT per ETF factsheets, October 2025
Here you see some pretty significant differences. BMO and Vanguard (especially BMO’s ZEQT) have a much heavier emphasis on “emerging” markets than XEQT does; TD’s TEQT has NO exposure to emerging markets at all.
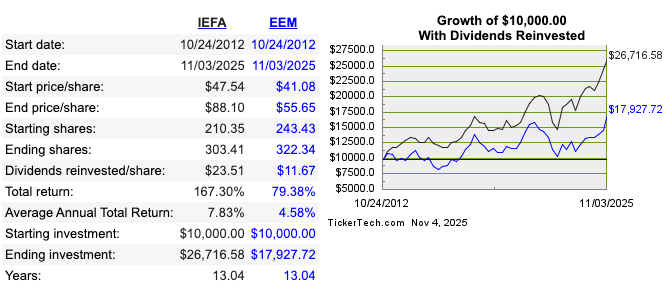
That’s an interesting strategic choice being made here. Let’s compare emerging market performance to mature international markets. We cand do that by looking at IEFA (mature markets) versus EEM (emerging markets)4:
Emerging markets have been a serious lag to global performance, so perhaps TD is on to something here. I played with this chart quite a bit and it’s only very lately (last 2 years or so) that emerging markets have outperformed the established ones. Long term trend? ZEQT certainly hopes so.
So on the international front, you have choices
TEQT only focuses on mature markets
XEQT allows some (not much) exposure to emerging markets
ZEQT and VEQT make much bigger bets on emerging markets
Which is the correct call? TEQT historically has made the right choice, but as the old adage goes “past performance does not guarantee future results” (or something like that).
I’m using the all-equity versions of these to make the comparison more apples-to-apples. VEQT has a larger Canadian percentage (30%) than the other 3 (25%), so I muliplied VEQT’s holdings by 25/30 to make the comparison meaningful. ↩︎
In this analysis, I’m not making a distinction between “mature” and “emerging” markets. Some of the funds do. In all cases, “International” means “no US, no Canada”. ↩︎
You can read about my asset-allocation approach to investing over here.
The view post-payday
I pay myself monthly in retirement, so that’s a good trigger to update this post. On October 27th, this is what it looks like:
The portfolio is dominated by my ETF all-stars; anything not on that page is held in a non-registered account and won’t be fiddled with unless it’s part of my monthly decumulation. Otherwise I’ll rack up capital gains for no real benefit.
No massive changes this month; the one you might notice is a slight shift from AOA to XGRO. I move some of my USD holdings into CAD every quarter, and last month was when I did it. The majority of my spending is in CAD, so I use Norbert’s Gambit to move funds around.
Plan for the next month
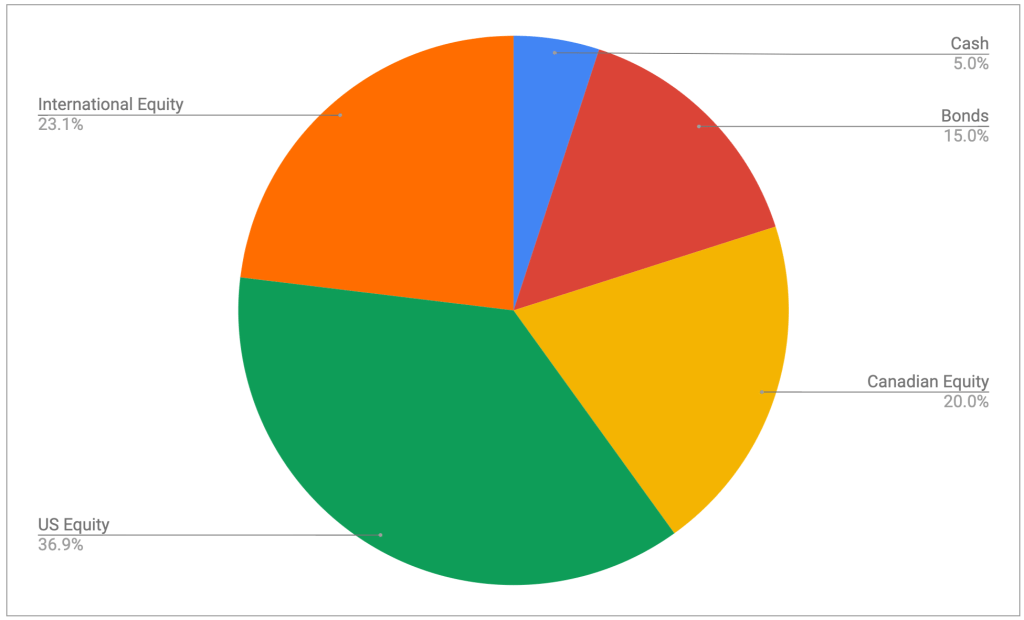
The asset-class split looks like this
It’s looking pretty close to the targets I have, which are unchanged:
5% cash or cash-like holdings like ICSH and ZMMK
15% bonds (almost all are buried in XGRO and AOA)
20% Canadian equity (mostly based on ETFs that mirror the S&P/TSX 60)
36% US equity (dominated by ETFs that mirror the S&P 500, with a small sprinkling of Russell 2000)
24% International equity (mostly, but not exclusively, developed markets)
All looks to be in order from an asset allocation perspective, no need to do anything here.
Overall
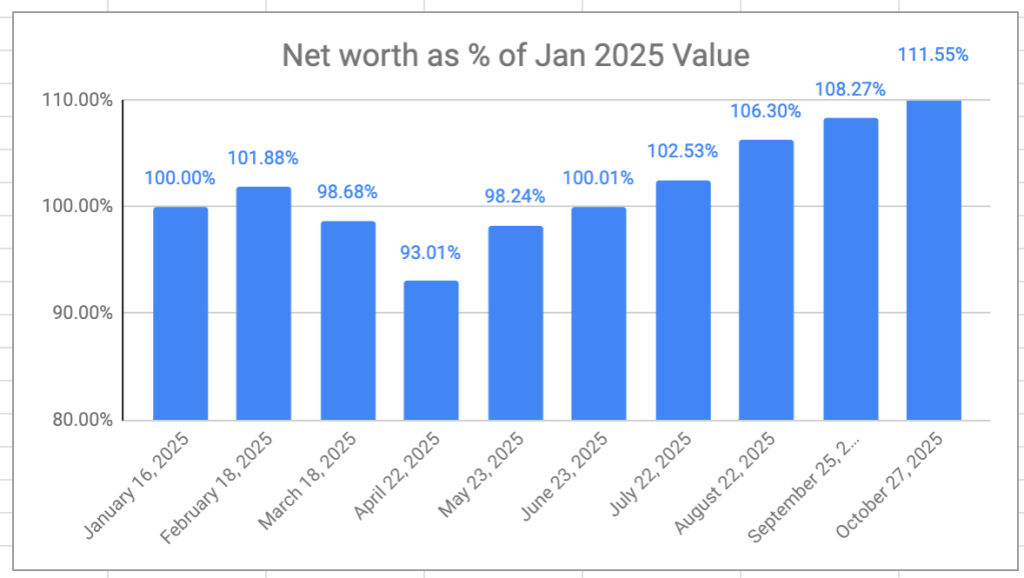
The retirement savings had a great month, again — a 6-month growth streak at this point. Overall, I’m now 11.5% ahead of where I started even though I’ve been drawing a monthly salary since the beginning of the year. I don’t really expect the winning streak to continue, but VPW allows me to take some benefit from the frothy stock markets at moment.
Net Worth as a percentage of starting point
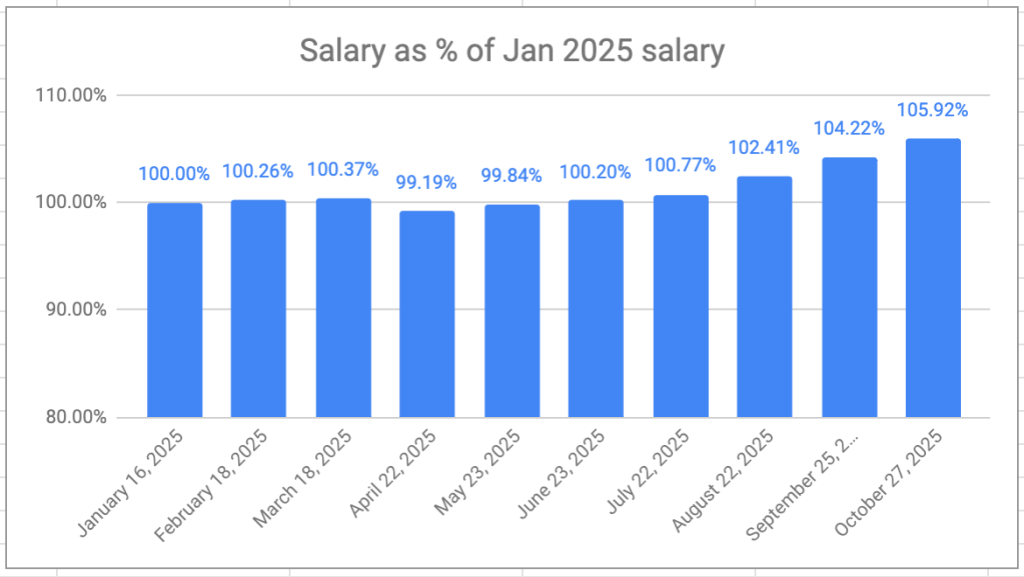
My VPW-calculated salary has hit a new high this year, 5.92% higher than my first draw in January. The monthly salary is also on a 6-month growth streak.
Monthly Salary as a Percentage of Jan 2025 salary
The months ahead will see the final “goodbye” to QTrade1 as the last of my RRIF investments will move to (mostly) Questrade2.
I didn’t have a great deal of issue with QTrade as a provider, but their support (lack thereof) was beginning to become irritating. ↩︎
My own QTrade RRIF will join the RRIF holdings I already have with Wealthsimple. They remain a potential backup provider of my retirement savings. I would have moved more to take advantage of their cashback promotion, but they still, inexplicably, do not support self-directed spousal RRIF accounts. ↩︎
(New to asset allocation ETFs aka all-in-ones? Here’s a good place to start.)
Asset allocation ETFs can be purchased from any number of companies. In this article, we look at 4 of the biggest names:
TD, with TEQT, TGRO, TBAL et al
Blackrock/iShares with XEQT, XGRO, XBAL et al
BMO with ZEQT, ZGRO, ZBAL et al
Vanguard with VEQT, VGRO, VBAL et al
The blueprint for each of these ETFs are similar: pick Canadian, US, International and (where applicable1) bond indices, pick a target percentage allocation for each slice of the pie, and carry on…
I previously talked about the variations in percentage allocation (the size of the pie slices) between the major funds over here.
But what about the indices that each of the major fund families track? What’s in the pie? Are there significant differences? Here’s a summary of what I found:
Bloomberg Global Aggregate Canadian Float Adjusted Bond
So there is variation in the pie recipes (the underlying indices), but is it really of any significance? At a glance, I wonder how different the offerings from iShares and BMO actually are — the same index providers show up in each. Without looking at what stocks are actually found in each of these, here’s a quick take, simply based on the names of the indices:
Canadian Equity: All of these funds hold the broad Canadian market, over three different index providers23. iShares and BMO use a capped index, which, in theory, should limit exposure to the very largest Canadian businesses somewhat.
US Equity: Three different index providers seen here (Solactive, S&P and CRSP). TD only holds large US companies, the others hold smaller and midsized US companies. In the last ten years, this has been a winning strategy, but it’s not always been that way.
International Equity: Three different index providers: Solactive, MSCI, FTSE. TD excludes emerging markets (e.g. Brazil, Russia, Taiwan, China, India). The others don’t.
Bonds: Hard to tell just based on the names, but three of them use the same FTSE index. Vanguard uses a Bloomberg index. So I’ll say that it’s likely that Vanguard’s bond portfolio will look different from the other three.
In a future post, I’ll delve into what the main holdings of each of these funds are in each of these categories to see what differences emerge. And whether these differences actually matter!
This excludes 100% equity funds like XEQT, naturally ↩︎
The “composite” in “Capped Composite” means “all the stocks of the TSX”. ↩︎
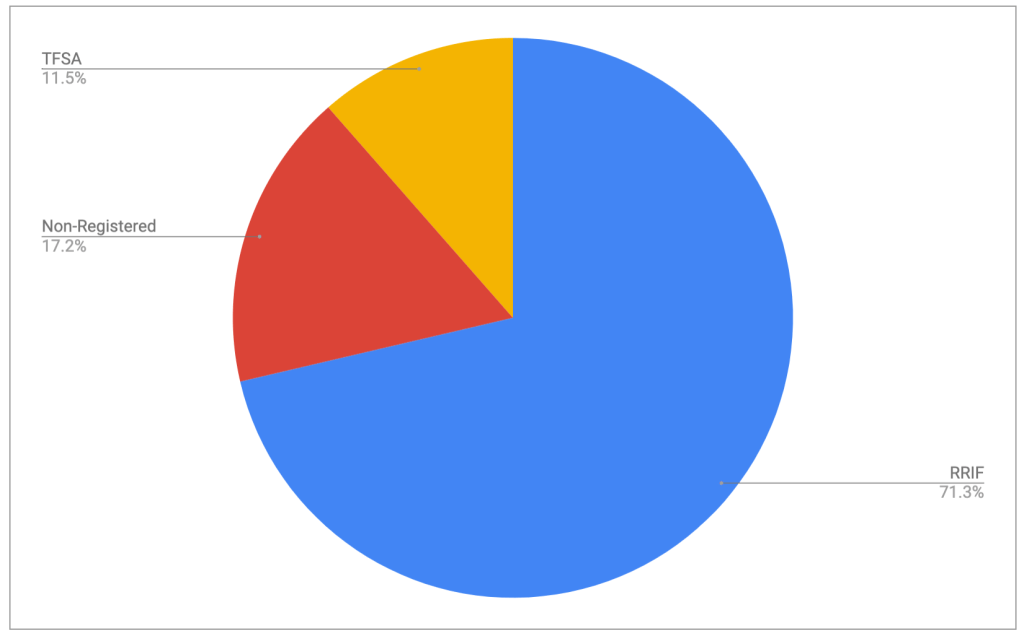
Every month, I try to share with you what’s in my overall retirement portfolio (September 2025 post is here). That retirement portfolio is actually distributed over a bunch of accounts held by me and my spouse and includes RRIFs, TFSAs and non-registered accounts. This is what it looks like at the moment:
Retirement savings as of October 1, 2025 by account type
(My multi-asset tracker is a handy tool to help you quickly create charts that look like the above one).
My current strategy for these three account types looks like this:
RRIF: This is 100% invested in my ETF all-stars. I’m currently withdrawing RRIF minimum payments for two main reasons:
To avoid problems with attribution. I cover that topic over here.
To avoid withholding tax. RRIF minimum payments don’t attract withholding tax, but I am setting aside some of my payments to deal with the unavoidable tax bill come April 2026. I talked about that topic over here.
TFSA: This is mostly invested in the ETF all-stars, but there’s a few stragglers in here1 that I really ought to get rid of. Nothing wrong with the funds in there, but it’s a needless complexity. The TFSA continues to get new funds since it’s hard to beat tax-free growth, and I only buy all-stars with those funds. It will get drawn down last in my retirement planning.
Non-registered accounts: Here it’s a bit of a dog’s breakfast, with very little invested in the all-stars, mostly because most of the equity found here was bought long ago, and changing what I hold would attract capital gains that I would prefer to take on my own terms. It’s where the majority of my early-retirement decumulation takes place.
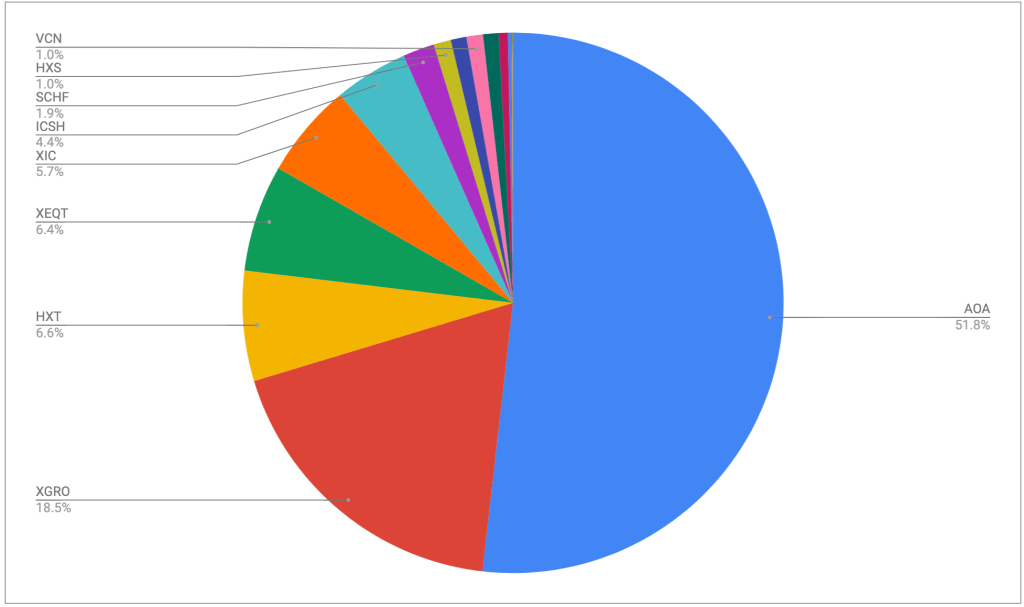
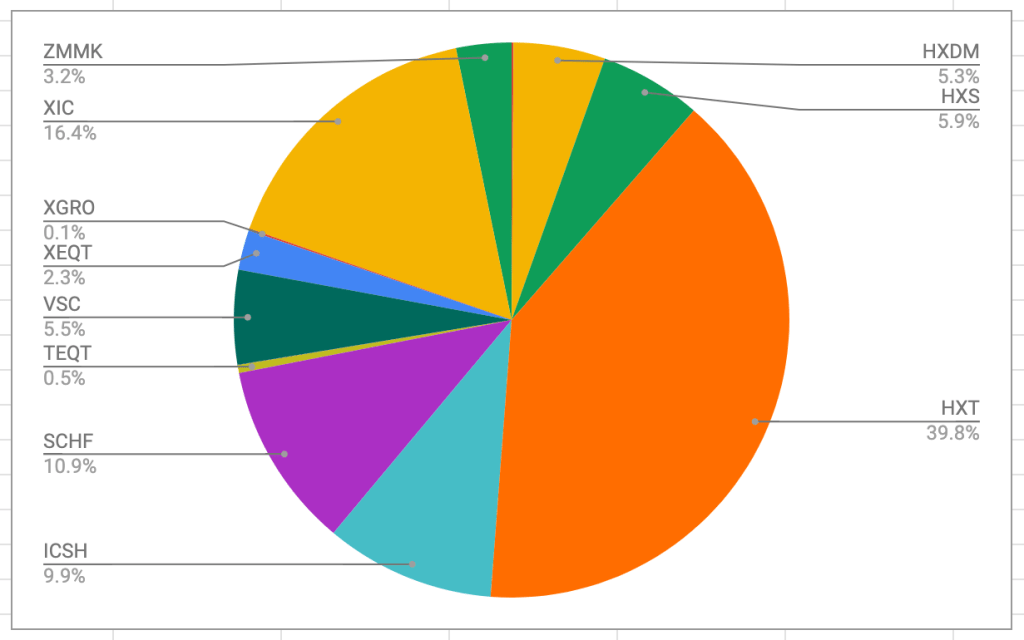
Here’s what that breakfast looks like:
What’s in my non-registered portfolio, October 2025
Here’s a look at each holding, from highest to lowest percentage.
HXT: This is a Canadian equity ETF that does not pay dividends, instead using some wizardry to bury it all in the per-unit price of the ETF. This simplifies taxes, and I have held this fund for a long time. Due to increasing costs of this ETF, it’s among the first to get liquidated as I need funds.
XIC: Canadian equity fund, very popular. I think I bought it to create a bit of dividend income. It will get liquidated after the Horizons funds go (HXS, HXT, HXDM).
SCHF: A very low-cost international equity2 fund in USD that I’ve held for a very long time. It’s funds like SCHF that attracted me to investing in USD, which, at present, adds a lot of complexity.
ICSH: This is one of the all-stars. It is what my VPW cash cushion is invested in3. I use ICSH more than ZMMK in the cash cushion because US interest rates are quite a bit higher than Canadian rates at the moment. I talked about that here.
HXS: Same idea as HXT, except it invests in the S&P 500. This one is held only by my spouse who is still working for a living, so this will just stick around a while, until she stops working and can take on the capital gains.
VSC: A bond fund held by my spouse. I may sell this to harvest some capital gains losses.
HXDM: Same idea as HXT, except international equity. It is on the list to liquidate.
ZMMK: An all-star, held in the same account as ICSH.
The rest (XEQT, TEQT, XGRO) are all new arrivals in the portfolio, purchased using dividends4 from the other funds as well as the bonus payments I keep collecting from Questrade for switching to them.
My non-registered accounts are only a small portion of my retirement holdings, but there’s a fair bit of complexity there. Over time, these accounts will go to zero other than the cash cushion portion (ZMMK, ICSH or whatever replacements I discover) which will remain as long as VPW is my decumulation strategy.
Mostly pure Canadian equity funds. This is to offset AOA that has next-to-no Canadian equity component. ↩︎
VPW = Variable Percentage Withdrawal, an absolutely brilliant strategy for making sure you don’t run out of money in retirement and don’t leave a lot on the table. Read all about it here. ↩︎
With all ETF trades being free, I hold very little actual cash in any of my accounts. ↩︎