In a previous post, I took a look at the major fund companies’ all-in-one-funds with a focus on what passive indices each of them folllowed with regards to Canadian equity, US equity, International equity, and bonds. That assessment found that iShares and BMO were very similar, but TD and Vanguard looked very different.
But do different indices really make a difference in terms of what each of these companies hold when it comes to equities? That’s what we’re trying to find out. Let’s take a look at each of the categories in turn.
Canadian Equity
Let’s take a look at the top Canadian equity holdings of TEQT, XEQT, ZEQT and VEQT1:
| Stock | TEQT % | XEQT % | ZEQT% | VEQT% |
|---|---|---|---|---|
| RBC | 1.65 | 1.73 | 1.62 | 1.80 |
| Shopify | 1.55 | 1.69 | 1.62 | 1.49 |
| TD | 1.12 | 1.16 | 1.10 | 1.16 |
| Enbridge | 0.84 | 0.88 | 0.85 | 0.92 |
| Brookfield | 0.82 | 0.82 | 0.78 | 0.81 |
| BMO | 0.74 | 0.77 | 0.72 | 0.77 |
| Agnico | 0.66 | 0.69 | 0.68 | 0.63 |
| Scotiabank | 0.64 | 0.67 | 0.63 | 0.68 |
| CIBC | 0.60 | 0.63 | 0.60 | 0.63 |
| CP KC | 0.57 | 0.58 | 0.57 | 0.62 |
| # held | 292 | 215 | 215 | 156 |
| Top 10 % | 9.19 | 9.62 | 9.17 | 9.51 |
VEQT has fewer holdings than the others, and this indicates slightly more concentration/slightly less diversification than the other funds. TEQT is at the top of the heap when it comes to the number of companies held, with XEQT and ZEQT looking pretty similar. My take here is that the differences between TEQT/XEQT/ZEQT/VEQT are pretty slight when it comes to Canadian equity. The Canadian equity indices these funds track may be different, but the differences are pretty minor, and might simply be attributable to tracking errors; how often and when these funds rebalance their holdings may explain the differences shown here.
But just for fun, I looked at comparing VCN (which is underneath VEQT, and tracks the FTSE Canada all cap) to XIC (which is underneath XEQT, and tracks the S&P/TSX Capped Composite) and found this using https://www.dividendchannel.com/drip-returns-calculator/ (which is also listed in Tools I Use).
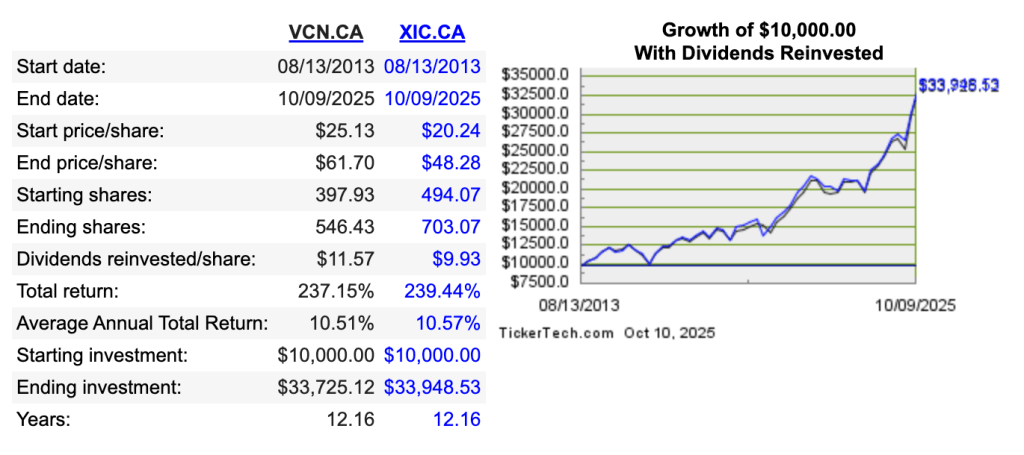
This indicates a tiny advantage to XIC aka the capped composite index, but there’s not a lot of daylight between these two returns!
On the Canadian Equity front, I declare the 4 funds EQUIVALENT!
US Equity
The US weighting is NOT the same for each of these funds, so making a one-to-one comparison is a bit tricky.
- TEQT: 55% US
- ZEQT: 50% US
- XEQT, VEQT: 45% US
What I show in the table below is the percentage of the US portion held by the fund. So in other words if stock XYZ makes up 5% of the US holdings of TEQT and XEQT, it means that TEQT actually holds more of XYZ because 55 cents of every dollar of TEQT is invested in XYZ as compared to 45 cents for XEQT et al.
| Stock | TEQT: TPU % | XEQT: XTOT % | ZEQT: ZSP/ZMID/ZSML% | VEQT: VUS% |
|---|---|---|---|---|
| NVIDIA | 7.81 | 6.91 | 7.35 | 6.45 |
| Microsoft | 6.62 | 5.71 | 6.26 | 6.02 |
| Apple | 6.38 | 5.53 | 5.99 | 5.54 |
| Amazon | 3.73 | 3.24 | 3.45 | 3.49 |
| Broadcom | 2.75 | 2.38 | 2.51 | 2.23 |
| Meta | 2.74 | 2.33 | 2.51 | 2.56 |
| Alphabet Cl A | 2.43 | 2.07 | 2.26 | 1.97 |
| Alphabet Cl C | 2.13 | 1.67 | 1.82 | 1.59 |
| Tesla | 2.12 | 1.80 | 1.91 | 1.46 |
| JP Morgan | 1.46 | 1.24 | 1.36 | 1.29 |
| Eli Lilly | 1.25 | 1.00 | 1.09 | 1.00 |
| Berkshire | 1.15 | 1.33 | 1.47 | 1.43 |
| # held | 504 | 2494 | 1511 | 3524 |
| Top 10 % | 38.17 | 32.97 | 35.54 | 32.74 |
What’s clear here is that TEQT is an outlier insofar as it only focuses on the largest US companies, with the other three funds including smaller companies. This also impacts how much money is found in the top 10 US holdings of TEQT, with 38% of holdings invested in names like NVIDIA, Microsoft, Apple et al.
This has proven beneficial of late since smaller US companies have not kept pace with the larger ones. Per spglobal.com, the 10 year performance as of Oct 13, 2025 of the three US market segments has been:
- S&P SmallCap 600 = 7.65%
- S&P MidCap 400 = 8.49%
- S&P 500 = 12.75%
Meaning that any fund that holds smallcap and midcap US stocks has had their returns dragged down in the past 10 years.
So my conclusion for US Equities is that TEQT is the performance champion, but this comes with a less diversification than the alternatives: not only does TEQT focus on the highest-performing portion of the US equity market, it also puts more money overall into the US equity market. This has worked well for the last ten years, but it’s anybody’s guess as to whether this is a good idea for the future.
International Equity
The International2 weighting is NOT the same for each of these funds, so making a one-to-one comparison is a bit tricky.
- TEQT: 20% International
- VEQT: 25% International
- ZEQT: 25% International
- XEQT: 30% International
BMO gets the “lack of transparency” award from me for their complex structure. ZEQT holds ZEA which holds European stocks as well as IEFA, which is their USD fund holding the same things. It also holds ZEM which holds emerging markets stocks as well as EEM, which holds similar things in USD. Nowhere can you find a BMO/ZEQT consolidated view like what I’m showing below.
Like in the previous examples, what I show in the table below is the percentage of the International portion held by the fund.
| Stock | TEQT: TPE % | XEQT: XEF/XEC % | ZEQT: ZEA/IEFA/ZEM/EEM% | VEQT: VIU/VEE% |
|---|---|---|---|---|
| Taiwan Semi | 0 | 1.73 | 5.88 | 4.19 |
| ASML | 1.98 | 1.43 | 2.11 | 1.59 |
| SAP | 1.43 | 1.03 | 1.37 | 1.14 |
| Nestle | 1.30 | 0.93 | 1.24 | 0.96 |
| Roche | 1.24 | 0.87 | 1.12 | 0.95 |
| Novartis | 1.24 | 0.90 | 1.17 | 0.98 |
| AstraZeneca | 1.24 | 0.93 | 1.26 | 0.94 |
| HSBC | 1.15 | 0.83 | 1.22 | 1.02 |
| Shell | 1.11 | 0.80 | 1.09 | 0.87 |
| Toyota | 1.06 | 0.70 | 0.97 | 0.85 |
| Siemens | 1.02 | 0.77 | 1.08 | 0.82 |
| Tencent | 0 | 0.80 | 2.75 | 2.10 |
| Samsung | 0 | 0.37 | 2.03 | 1.16 |
| Alibaba | 0 | 0.40 | 1.87 | 1.59 |
| # held | 893 | 5626 | 3864 | 3524 |
| Top 10 % | 12.77 | 10.25 | 20.89 | 15.68 |
Here you see some pretty significant differences. BMO and Vanguard (especially BMO’s ZEQT) have a much heavier emphasis on “emerging” markets than XEQT does; TD’s TEQT has NO exposure to emerging markets at all.
That’s an interesting strategic choice being made here. Let’s compare emerging market performance to mature international markets. We cand do that by looking at IEFA (mature markets) versus EEM (emerging markets)4:
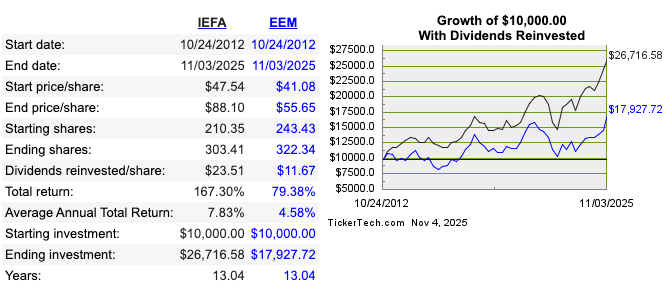
Emerging markets have been a serious lag to global performance, so perhaps TD is on to something here. I played with this chart quite a bit and it’s only very lately (last 2 years or so) that emerging markets have outperformed the established ones. Long term trend? ZEQT certainly hopes so.
So on the international front, you have choices
- TEQT only focuses on mature markets
- XEQT allows some (not much) exposure to emerging markets
- ZEQT and VEQT make much bigger bets on emerging markets
Which is the correct call? TEQT historically has made the right choice, but as the old adage goes “past performance does not guarantee future results” (or something like that).
- I’m using the all-equity versions of these to make the comparison more apples-to-apples. VEQT has a larger Canadian percentage (30%) than the other 3 (25%), so I muliplied VEQT’s holdings by 25/30 to make the comparison meaningful. ↩︎
- In this analysis, I’m not making a distinction between “mature” and “emerging” markets. Some of the funds do. In all cases, “International” means “no US, no Canada”. ↩︎
- And EEM, and IEFA, and ZEA and ZEM fact sheets ↩︎
- You could also compare XEF to XEC and come up with a similar picture. ↩︎