This is a (hopefully monthly) look at what’s in my retirement portfolio. The original post is here. Last month’s is here.
Portfolio Construction
The retirement portfolio is spread across a bunch of accounts:
- 7 RRIF accounts (3 for me, 3 for my spouse, 1 at an alternative provider as a test)
- 2 TFSA accounts
- 4 non-registered accounts1, (1 for me, 1 for my spouse, 2 joint)
The target for the overall portfolio is unchanged:
- 80% equity, spread across Canadian, US and global markets for maximum diversification
- 15% Bond funds, from a variety of Canadian, US and global markets
- 5% cash, held in savings-like ETFs.
The view as of this morning
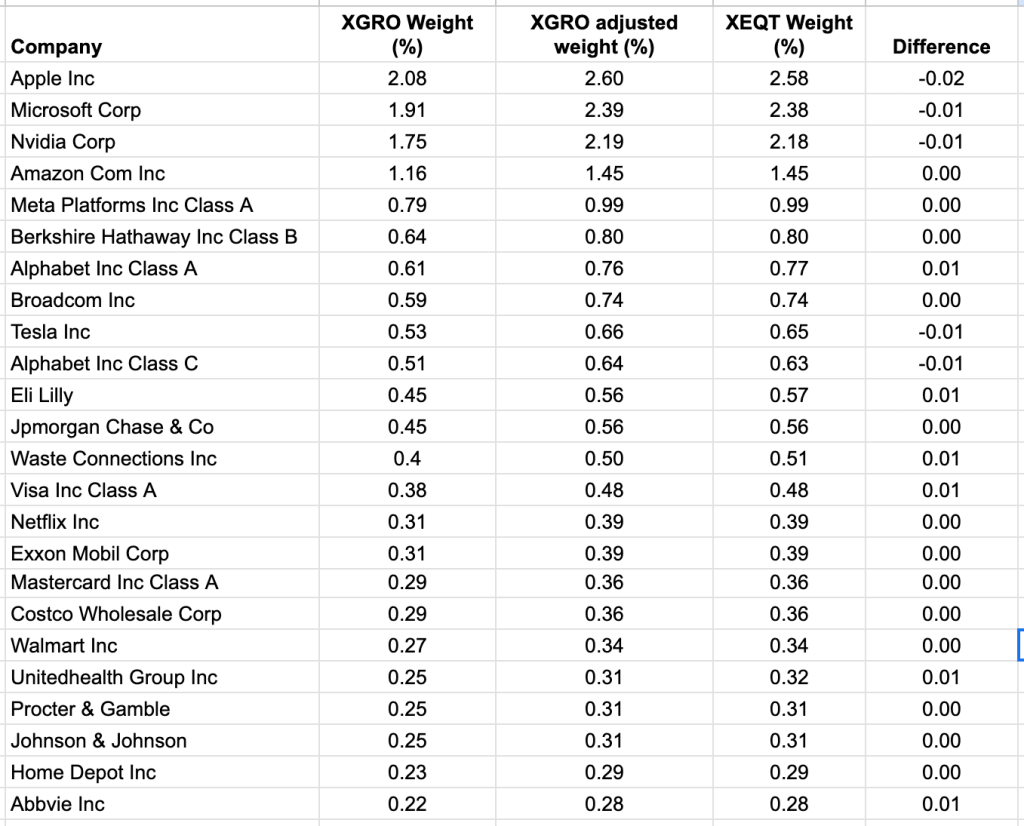
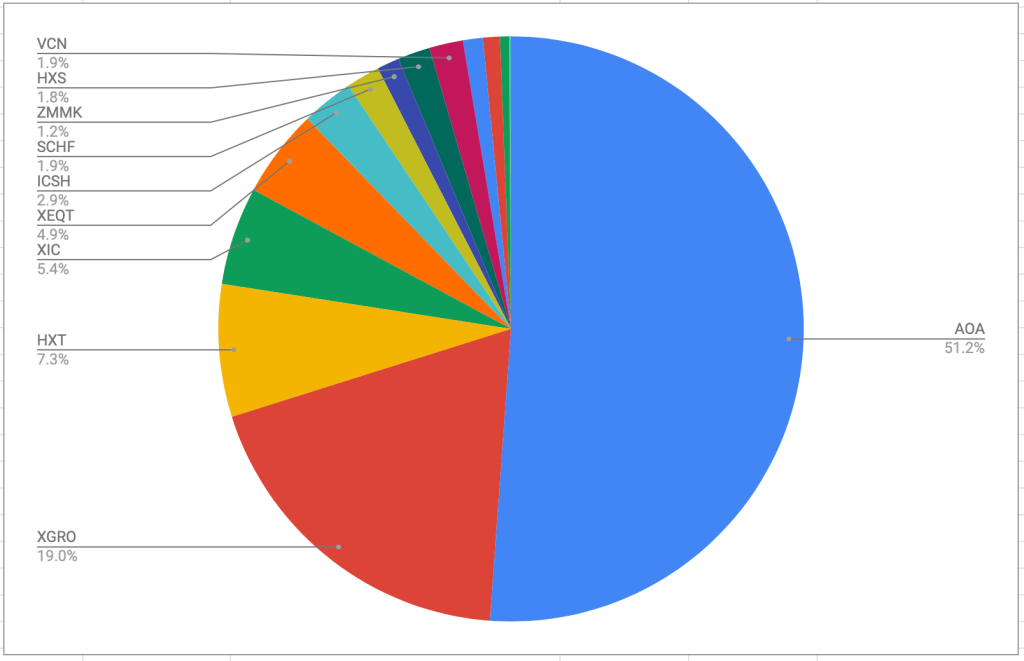
As of this morning, this is what the overall portfolio looks like:

The portfolio is dominated by my ETF all-stars; anything not on that page is held in a non-registered account and won’t be fiddled with unless it’s part of my monthly decumulation. Otherwise I’ll rack up capital gains for no real benefit.
The biggest changes were caused by two events that happened over the past 30 days:
- I did a small rebalancing exercise to reduce my exposure to the Canadian equity market, selling VCN in favor of XEQT. (XEQT is only 23% Canadian equity per dollar invested; VCN was 100%). This sort of rebalancing happens whenever I drift more than 1% off of my target allocations.
- I took some cash from a HISA and invested it in ZMMK; for reasons too boring to report here, that money was effectively not being tracked in these pages until this month — that anomaly won’t be repeated in subsequent months since ZMMK and ICSH are where I park the “cash” position of my portfolio.
Plan for the next month
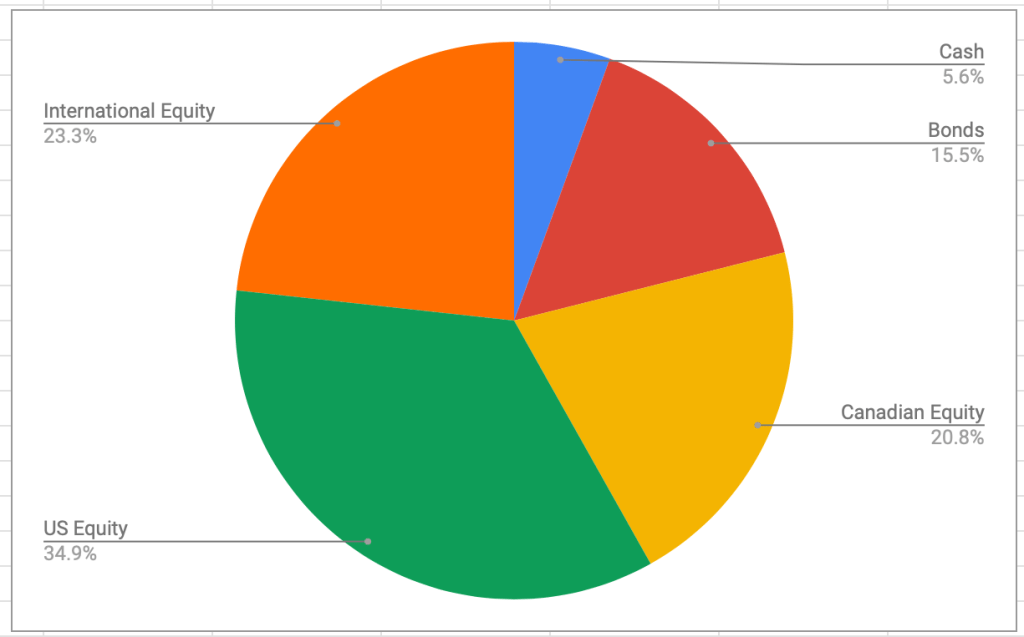
The asset-class split looks like this
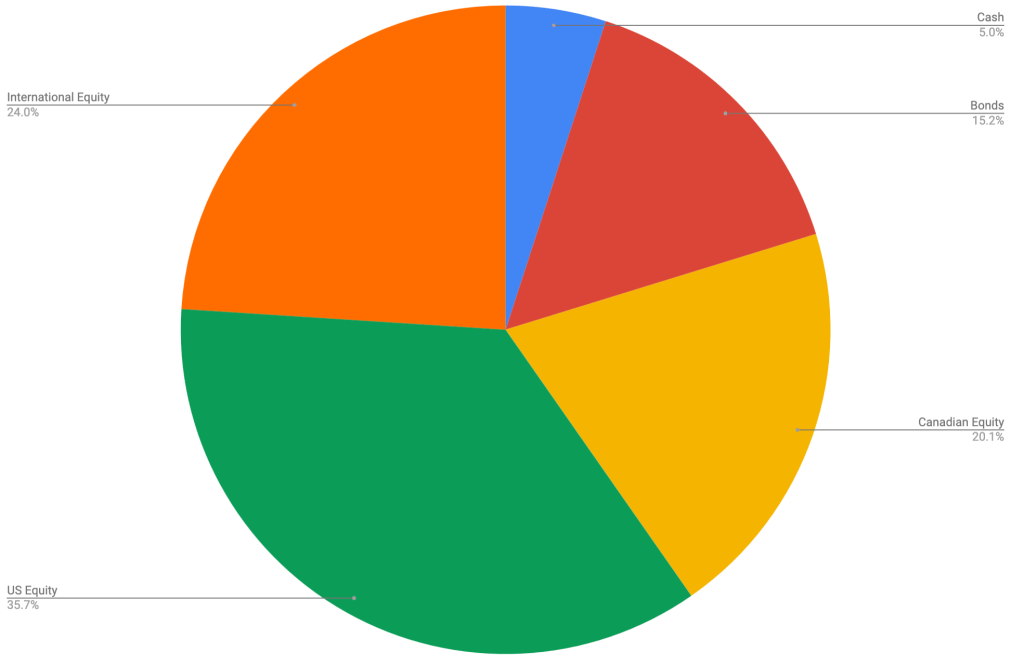
This looks to be pretty close to my target percentages which haven’t changed:
- 5% cash or cash-like holdings like ICSH and ZMMK
- 15% bonds (almost all are buried in XGRO and AOA)
- 20% Canadian equity (mostly based on ETFs that mirror the S&P/TSX 60)
- 36% US equity (dominated by ETFs that mirror the S&P 500, with a small sprinkling of Russell 2000)
- 24% International equity (mostly, but not exclusively, developed markets)
So, the plan for next month is, do nothing out of the ordinary. Reinvest cash (dividends, TFSA contributions) in one of AOA, XEQT/XGRO, ICSH or ZMMK depending on the asset category most in need on the day of the reinvestment. All these ETFs are covered on my ETF All-Stars page.
One thing I may do is to try to make shifts2 to get a little more return out of my cash position. US interest rates are quite a bit higher than Canadian rates, and so if my cash position is held in USD, I stand to eke a few more points of return there. TBD.
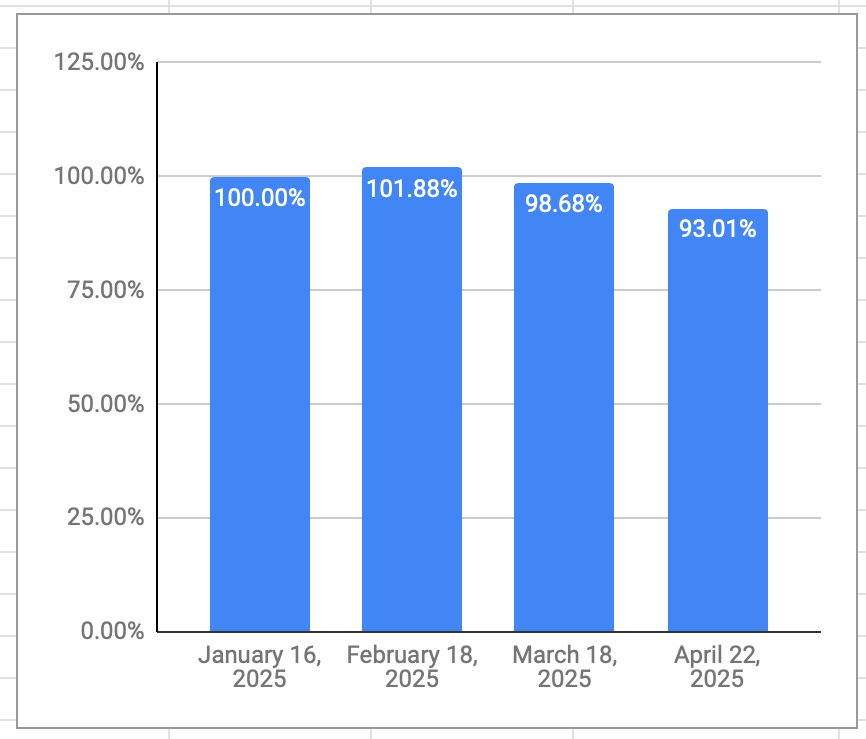
Overall
My retirement savings had a nice bounce-back this month, looks like I can cancel the mega-pack of pot noodles I had on order.

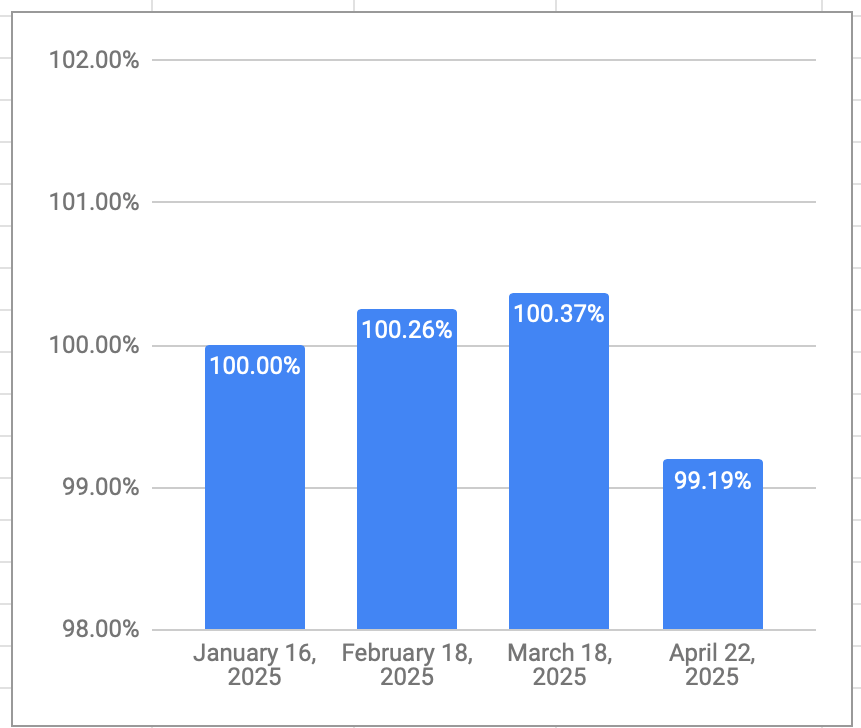
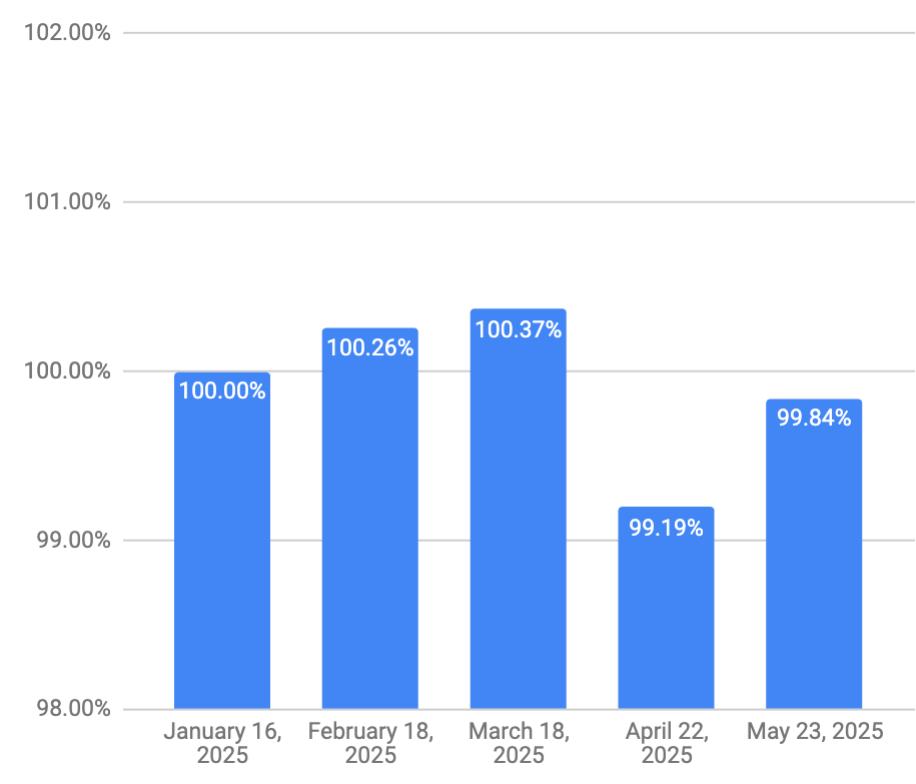
The salary I collect month to month recovered a bit, too, although not as quickly. That’s the magic of using VPW’s cash cushion — neither boom nor bust months translate into large changes in the take-home pay.
- That’s up one from the previous month. In order to collect on Questrade’s transfer bonus, (which they have yet to pay me, they are apparently in a world of hurt on the IT front) you have to have a non-registered account to get paid into. The other 3 are “normal” — one non-registered account for me, one for my spouse, and jointly held one that serves as a cash cushion to smooth out month to month variations in my retirement salary. Read more about that over at https://moneyengineer.ca/2025/01/31/im-retired-now-how-do-i-get-paid/ ↩︎
- With Questrade, all ETF trades are free to make, so I don’t have any real reason not to make such changes. ↩︎