The Money Engineer now on YouTube

Early on when I first launched this blog, one of my friends suggested that video content would be ideal for the topics I wanted to cover. “I’m a visual learner” was her pitch1. I did hesitate because I wasn’t sure what I would post there.

But the hesitation is over, and I’ve launched a YouTube channel which you can find in the top menu (“Videos”) or you can go to it directly: https://www.youtube.com/@MoneyEngineerCA.

The first video2 is a quick intro to the Multi-Asset Tracker, a Google Sheets template that’s based on my personal spreadsheet that I’ve developed over the years.

Today’s video is a quick look at BlackRock’s family of asset-allocation ETFs (XEQT, XGRO, XBAL, XCNS and XINC) and what makes the members of the family different.

My philosophy is to keep the videos short with no window dressing. There’s no big intro, no sponsor plugs3, no big plea to “Like and Subscribe”, and no theme music. We get going right from the opening frame. I reserve the right to jazz things up later, but with 2 views thus far I’m not too worried about going viral anytime soon.

If you have thoughts/comments/ideas about the videos, feel free to drop me a line at comments@moneyengineer.ca.

  1. Although I do love an elegant diagram or chart, as my kids will tell you, I have very little patience for a 3 minute YouTube video telling me how to change a setting on my iPhone. ↩︎
  2. Recorded on April 1st, but it’s no joke ↩︎
  3. At least, none coming from me — YouTube ad insertion is not something I can control, at least as far as I can figure out. ↩︎

How I think about investing: Asset classes

Passive investing while ensuring good diversification has been my strategy for decades. But how do I define “diversification”? For me, it’s always been about paying attention to how much of my total portfolio was invested in each of five1 asset classes and keeping them aligned with my targets:

  • Cash or cash equivalents
  • Bonds2
  • Canadian Stocks
  • US Stocks
  • International Stocks3

I got this idea from my last financial advisor who provided me with a lovely Cerlox4 bound annual report showing me how hard they were working on my behalf5. The report included a pie chart of how my investments broke down. This is what that pie chart looks like in my portfolio this morning:

Retirement portfolio by asset class, March 28, 2025

This pie chart has been my guiding principle: have a target percentage for each asset class in mind, and adjust your portfolio as needed to keep the percentages in line. This simple principle has been adopted by so-called asset allocation ETFs aka “all-in-ones” like (my personal favourites) XGRO6 and AOA7.

But are these even the right asset classes? Where are REITs8? Where’s precious metals? Where’s Bitcoin9? What’s your bond duration? Do you have enough exposure to high-growth geographies?

Short answer: just like I’m too lazy to pick stocks, I’m too lazy (and not smart enough) to pick a “winner” of a given asset class. The “periodic table” of investment returns by asset class is a must-read for DIY enthusiasts out there: https://themeasureofaplan.com/investment-returns-by-asset-class/ (go ahead, take a look, I’ll wait).

The folks at Measure of a Plan agree that trying to figure out the “hot” asset class is a very difficult task:

It’s no easy feat to pick the winner in a given year. The asset class rankings appear to be randomly tossed about over time, with the top performer in one year often falling down to the middle or bottom of the table in the next year.

https://themeasureofaplan.com/investment-returns-by-asset-class/

By keeping an eye on the pie chart, and shifting investments to align with my targets, I’m never at risk at being overweight in any one asset-class, and beaten-down asset-classes naturally get more funds to get the percentages right. It’s naturally causing “buy low, sell high” behaviour.

So: what about the asset classes I’m using? Are 5 asset classes too many? Too few? I don’t know. “Good enough” is sort of my philosophy in the spirit of trying to keep things simple.

The spreadsheet I’ve used to help me track my portfolio breakdown is found here. In future posts, I’ll talk a bit about how to make it work for you.

  1. For a long time, “cash” was not part of the consideration. Leading up to retirement, I started to carry a 5% cash weighting to help cushion market swings. ↩︎
  2. In years past, I did try to keep track of short-term versus mid-term versus long-term bonds. I gave up on that. ↩︎
  3. In years past, I did try to keep track of developed markets versus emerging markets. I gave up on that. ↩︎
  4. I had to look up how this was spelled. https://www.collinsdictionary.com/dictionary/english/cerlox ↩︎
  5. The fact that this report looked the same as the reports generated by two other advisors led me to the conclusion that my hard working advisor was perhaps being assisted by commercial software. ↩︎
  6. Overview of XGRO’s asset allocation strategy: https://www.blackrock.com/ca/investors/en/literature/product-brief/ishares-core-etf-portfolios-brochure-en.pdf ↩︎
  7. Overview of AOA’s asset allocation strategy: https://www.ishares.com/us/literature/product-brief/ishares-core-esg-allocation-brief.pdf ↩︎
  8. My first list of asset classes prepared circa 20 years ago did include REITs but I dropped that class, figuring (perhaps incorrectly) that the bond portion of the portfolio was good enough. Doing a bit of digging, I see that both AOA and XGRO hold REITs, and both consider them “equity” investments. ↩︎
  9. It’s actually obligatory for any article on investing to mention one (or more) cryptocurrencies, and/or one (or more) meme stocks 😉 ↩︎

Questrade Bonus Capability: Passiv

**** Update: Per email communication on October 24 2025, as of January 31, 2026, Passiv will not be offered at all by Questrade, as they are planning to launch their own integrated portfolio monitoring and rebalancing tools”.

**** Update: As of June 1, 2025, Passiv Elite is no longer offered for free for Questrade Clients. It’s now part of a subscription service called Questrade Plus***

As you may have heard, I’m in the middle of a transition between online brokers1. And so I’ve been spending some more time getting to know what Questrade offers to the DIY investor besides free buying and selling of stocks and ETFs.

One thing I looked into lately was Passiv, a service that is offered for free for all Questrade clients.

In brief, Passiv is a 3rd party web application2 that allows you to track your investments from a single screen, no matter if they are found in multiple investment vehicles (e.g. TFSA, RRSP, RRIF) or if they are found across multiple providers (full list of supported brokers is here)3.

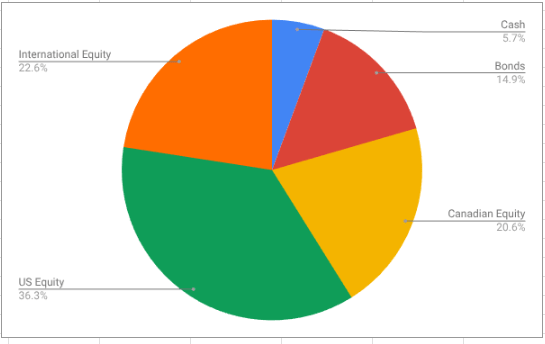
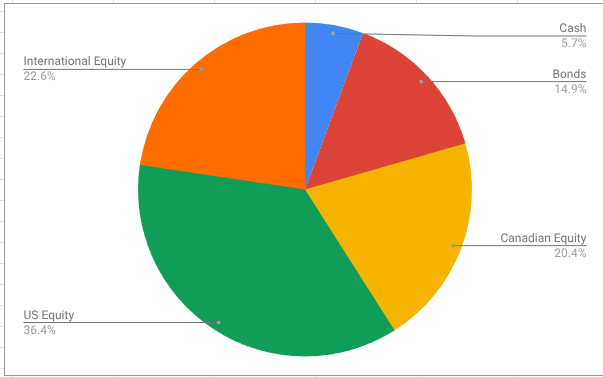
What’s more, it also evaluates your portfolio against a model that you define. For example, if you (like me) have an investment portfolio with a target allocation of 5% cash, 15% bonds, 20% Canadian equity, 36% US equity, and 24% international equity, Passiv can assess your current holdings against these targets, and even do the trades to rebalance the portfolio!

Astute readers will note these are a lot of the same benefits I’m a fan of — and one of the big reasons most of my portfolio is invested in all-in-one asset allocation ETFs. (Are these ETFs unfamiliar? You can read about them here.)

I tried to use Passiv to model my own portfolio, but discovered that all-in-one asset allocation ETFs aren’t really supported by the tool4. Once I thought about it some more, it’s clear why — Passiv really markets itself as an ALTERNATIVE to using all-in-ones. Here’s a clear marketing pitch from Passiv that demonstrates its approach: https://passiv.com/feature-posts/model-portfolios-that-cost-less-than-all-in-one-funds-or-robo-advisors.

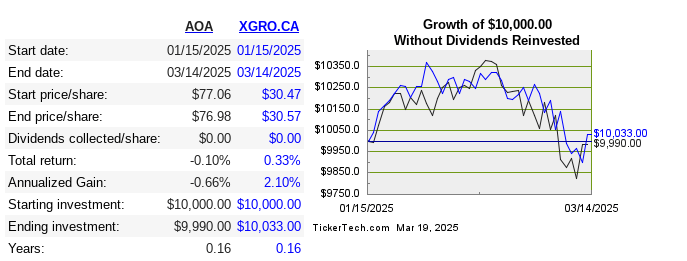
So to get the full benefit of Passiv, instead of holding XGRO, you would instead hold the constituent components of XGRO, a fund I’ve broken down previously. This would save you some management fees over time. Passiv helpfully does the math to calculate how much here5.

As a certified cheapskate, I’m always interested in saving a bit of money. But there are some downsides I could see in the Passiv approach:

  • You have to actually DO the rebalancing now and then. Not a big deal, but a fund like XGRO does this as part of their offer6.
  • You have to do the rebalancing no matter what. By this I mean that you have to buy when others are selling, and sell when others are buying. You can’t get overly attached to any one segment of your portfolio, because then you start making bad decisions based on “gut instinct”. Humans are notoriously bad at this7.

On the plus side, you will definitely save on management fees, and you could certainly tweak the contents to avoid products you wouldn’t normally buy (e.g. XGRO has some hedged funds, which I don’t like, typically).

An unknown for me is how foreign exchange is handled. That’s always something I consider since a lot of my retirement savings are in USD. Some experiments required 🙂

Anyway, it’s given me something to think about. I’ll have to see how easy it is to use in practice once all my accounts are back in place. Any Passiv users out there? I’m interested in your take — just drop a line to comments@moneyengineer.ca.

  1. And some (not all) of the funds are now showing up in Questrade, about 3 weeks after starting the process. Switching providers is not for the impatient. ↩︎
  2. WARNING: they don’t have an app. But someone named “Pasiv” does, and it looks very similar. ↩︎
  3. Other benefits include tracking of dividends, performance charts, etc. All stuff Questrade is apparently not very good at. ↩︎
  4. One asset class per stock symbol. My home-grown spreadsheet supports dividing symbols by asset class. ↩︎
  5. The calculation doesn’t include Passiv’s fees for the service, which are waived if you are Questrade client. ↩︎
  6. Per BlackRock “XGRO’s portfolio will be monitored relative to the asset class target weights and will be rebalanced back to asset class target weights from time to time at the discretion of BlackRock Canada and/or BTC. Generally, XGRO’s portfolio is not expected to deviate from the asset class target weights by more than one-tenth of the target weight for a given asset class.” [source] ↩︎
  7. If you’re interested in how behavior shapes investing, https://www.looniedoctor.ca/2024/12/13/etf-investor-behavior/ is a very good introduction to the topic. ↩︎

What’s in my retirement portfolio (March 2025)

This is a (hopefully monthly) look at what’s in my retirement portfolio. The original post is here. Last month’s is here.

Portfolio Construction

The retirement portfolio is spread across a bunch of accounts1:

  • 7 RRIF accounts (3 for me, 3 for my spouse, 1 at an alternative provider as a test)
  • 2 TFSA accounts
  • 5 non-registered accounts, (2 for me 1 for my spouse, 2 joint)

The target for the overall portfolio is unchanged:

  • 80% equity, spread across Canadian, US and global markets for maximum diversification
  • 15% Bond funds, from a variety of Canadian, US and global markets
  • 5% cash, held in savings-like ETFs.

The view as of this morning

As of this morning, this is what the overall portfolio looks like:

Overall retirement portfolio by holding, March 2025

The portfolio, as always, is dominated by AOA and XGRO which are 80/20 asset allocation funds in USD and CAD, respectively. The rest are primarily either cash-like holdings in two ETFs: ZMMK2 in CAD and ICSH3 in USD) or residual ETFs held in non-registered accounts for which I don’t want to create unnecessary capital gains just for the sake of holding AOA or XGRO.

The biggest month over month change is due to switching brokers. My old broker (QTrade) allowed the purchase of HISAs, but my new broker (Questrade) doesn’t seem to offer them4. So I replaced DYN6004 with ZMMK and DYN6005 with ICSH. I made these changes in my QTrade account to avoid any problems with doing an “in-kind” transfer to Questrade.

I’m still in need of USD to pay off some vacation bills, so there is a small hit to SCHF to help out.

Plan for the next month

The asset-class split looks like this

Overall retirement portfolio by market, March 2025

The international equity percentage is below my target of 24%, and so I’ll have to fix that5. VEU looks like it provides exposure to both developed and emerging markets at a rock-bottom price6. XEF would be a perfect fit in the Canadian market, although I should probably also consider XEC to get some emerging markets exposure.The cash position is artificially high because I already did the necessary transactions to get paid out of my RRIF and non-registered accounts (if I did this exercise at the beginning of the month, rather than mid-month, that would disappear). That extra cash will flow to my bank account in the coming days.

A quarterly activity that I’ll be performing this month7 is to shift some of my USD RRIF holdings into my CAD RRIF. I do this to make sure I’m not overexposed to changes in the CAD/USD exchange rate. My current provider reportedly allows me to make RRIF payments natively in USD, so that may be another option to consider. I’ll make an attempt at some point!

One final note: my retirement savings declined 3%8 over the month due to the wild (mostly downward) swings in the stock market, but this leaves me roughly even since my retirement started at the beginning of the year. Here’s the monthly returns for the 2 ETFs that make up the lion’s share of my portfolio9.

XGRO and AOA monthly returns so far
  1. The list is sort-of accurate. I’m in the middle of changing online brokers and since Questrade combines USD and CAD assets in one account, the number of accounts is diminishing. ↩︎
  2. Current 12-month yield: 3.6% ↩︎
  3. Current 30-day SEC yield: 4.61% ↩︎
  4. This specific topic addressed at https://www.financialwisdomforum.org/forum/viewtopic.php?t=125308. ↩︎
  5. The observant reader will note I also said this LAST month. That was before I decided to switch brokers. Once my holdings settle at Questrade, I’ll revisit. ↩︎
  6. MER = 0.04%. VEU has some Canadian exposure too, which isn’t ideal, but I don’t think there’s a USD ETF that excludes both Canada and the USA. ↩︎
  7. And should have done last month, sorry. ↩︎
  8. It would have been worse, except the USD also went up versus the Canadian dollar in the time period. Diversification works 🙂 ↩︎
  9. “Without dividends reinvested” since these two ETFs only pay out quarterly. There haven’t been any yet — next month! ↩︎

What’s the deal with AOA?

***Updated numbers February 2026***

As mentioned elsewhere, I rely heavily on all-in-one ETFs in my retirement portfolio. New to all-in-ones? Read a bit about them here.

Previously ,I covered what’s in XGRO, which is an all-in-one you can purchase on the Canadian market. Because I also happen to have a lot of US dollar-based retirement savings, I have the majority of those funds invested in AOA. AOA is an 80/20 fund 1 offered by BlackRock. It seems that this sort of all-in-one is not as popular in the US as Canada, not sure why2. I see offerings from State Street that sound similar. BlackRock has other members of their asset allocation family with different equity percentages — there’s something for everyone!3

I thought it would be interesting to see what, exactly, is underneath every $100 you invest in AOA. So by reading AOA’s ETF description, following the ETF descriptions of what’s inside AOA, and doing a little math, I came up with the following breakdown4:

FundWhat is it?How much?Colour Commentary
IVV US stock coverage that tracks the S&P 500 Index, 500 of the largest US companies $44.53 of your $100 investment

(of which ~3.50$ is in Nvidia, ~$3 in Apple, and ~$2 in Microsoft, with ~$1 in Amazon, Alphabet, Meta, Broadcom and Tesla)
The Magnificent 7 and 493 other companies
IDEVBroad international (ex-US) developed market stock coverage that tracks the MSCI WORLD ex USA IMI Index, about 2250 companies $23.02 of your $100 investment

(of which ASML gets 42 cents, Roche gets 26 cents…)
This also includes a tiny slice of Canada…top holding is RBC at 18 cents of your $100
IUSBBroad US Bond market exposure, about 16,000 bonds from government and corporate entities$16.36 of your $100 investment

(of which $6.45 is in US Treasury, $1.44 is in the Federal National Mortgage Association…)
12 month trailing yield is 4.18%, not too shabby
IEMG3500 or so international companies from emerging markets, following the MSCI Emerging Markets Investable Market Index $9.29 of your $100 investment

(of which $1.06 is in Taiwan Semi, 42 cents is in Samsung..)
23% China, 22% Taiwan, 16% South Korea, 14% India,
IAGGAbout 5800 international bonds tracking the Bloomberg Global Aggregate ex USD 10% Issuer Capped (Hedged) Index5$2.83 of your $100 investment

(of which 30 cents is Japanese T-Bills)
Trailing 12 month yield = 3.27%, has lost a full point in the last year
IJHUS Midmarket stocks that track the S&P MidCap 400 Index$2.59 of your $100 investment (of which 2 cents is in Lumentum, who I’ve never heard of)25% Industrials, 15% Financials…
IJRUS Small Cap stocks that track the S&P SmallCap 600 Index $1.22 of your $100 investment
(largest holding is Solstice Advanced Materials)
IJH+IJR+IVV is sort of similar to ITOT
Main components of AOA as of February 2025

Like XGRO, investing in an all-in-one like AOA provides you with exposure to a bunch of different asset types across many different geographies in one product, including all of the “hot” stocks you read about ad nauseam. Diversification under one banner.

The big difference from XGRO is the very tiny representation of Canada overall. I worked it out to about 2.5% of the overall number, which makes sense given the size of Canada on a global scale.

I came across the “Three Fund Portfolio” popularized by Bogleheads over 15 years ago. AOA and its family members is more or less that concept.

  1. Shorthand for “80% equity, 20% bonds”. There remains a lot of disagreement about the appropriate asset allocation, e.g. https://www.bogleheads.org/forum/viewtopic.php?t=210178 ↩︎
  2. Instead, I see a lot of “target date” retirement ETFs, which are in some ways similar, but lower the equity percentages as you get closer to the target date. ↩︎
  3. There’s also AOR (60% equity), AOM (40% Equity) and AOK (30% Equity) ↩︎
  4. Compare with the XGRO breakdown at https://moneyengineer.ca/2025/01/30/whats-the-deal-with-xgro/ ↩︎
  5. That’s a mouthful. ↩︎