
This is a (hopefully monthly) look at what’s in my retirement portfolio. The original post is here.
Portfolio Construction
The retirement portfolio is spread across a bunch of accounts:
- 7 RRIF accounts (3 for me1, 3 for my spouse, 1 at an alternative provider as a test)
- 2 TFSA accounts
- 5 non-registered accounts2, (2 for me 1 for my spouse, 2 joint)
The target for the overall portfolio is unchanged:
- 80% equity, spread across Canadian, US and global markets for maximum diversification
- 15% Bond funds, from a variety of Canadian, US and global markets
- 5% cash, held in high interest savings accounts (list available to me shown here)
The view as of this morning
As of this morning, this is what the overall portfolio looks like:
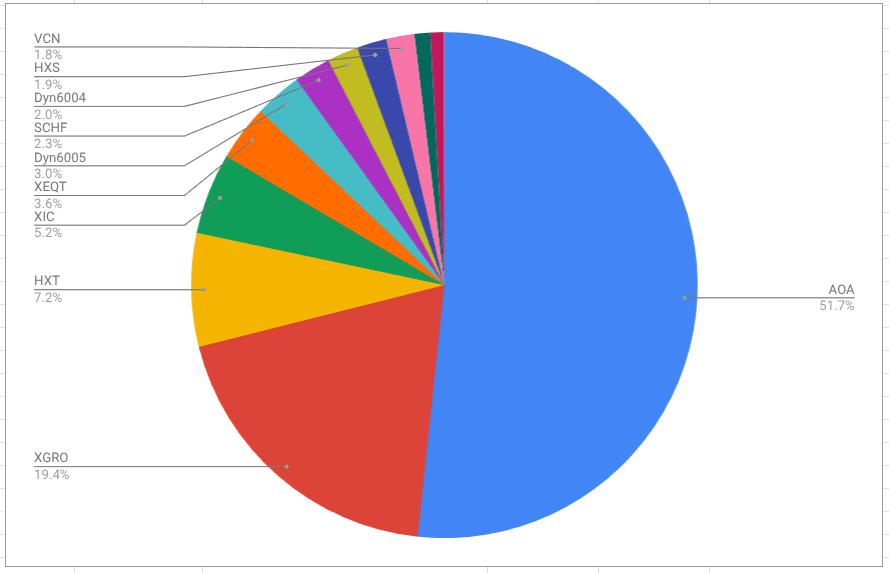
The portfolio, as always, is dominated by AOA and XGRO which are 80/20 asset allocation funds in USD and CAD, respectively. The rest are primarily either cash holdings in HISAs (DYN6004/5 in CAD and USD) or residual ETFs held in non-registered accounts for which I don’t want to create unnecessary capital gains just for the sake of holding AOA or XGRO.
The biggest month over month change is due to a small re-balancing exercise. I replaced some of my XGRO (which is an 80/20 equity/Bond asset allocation fund) with XEQT (a 100% equity asset allocation fund). I do re-balancing any time my asset allocation drifts more than 1% off my target allocations3. The trigger for me was an overweighting in bonds, which had drifted to represent 16% of my portfolio instead of the desired 15%. Upon reflection, the reason was obvious: both AOA and XGRO are 20% bonds, and if I want only 15% bonds, I will periodically need to fund an all-equity alternative. The net effect will be that you will see more XEQT show up in the portfolio over time.
The observant reader will also notice a bit of a shift between DYN6004 and DYN6005. The reason? I raided some USD from DYN6005 to pay my US credit card bill and replaced it with CAD in DYN6004 using the spot FX rate at the time. Seemed the easiest way to get some USD4 without having to resort to my friends at Knightsbridge.
SCHF percentages drifted down a bit since that’s the ETF I’m selling in my non-registered portfolio to augment my monthly RRIF payments. That will continue for the next few months at least since the USD payouts are needed to fund a few holidays5 I’m taking that are billed in USD.
Otherwise, nothing interesting to see in the month to month changes.
Plan for the next month
The geographic split looks like this
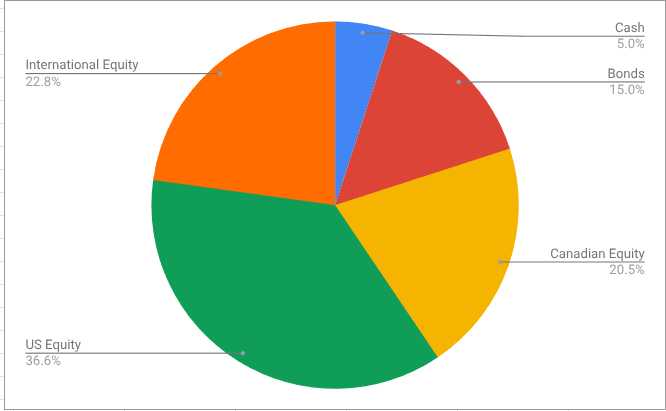
The international equity percentage is below my target of 24%, and so I’ll have to fix that. SCHF seems a good choice in USD6 since it’s free to trade with QTrade. XEF would be a perfect fit in the Canadian market.
A quarterly activity that I’ll be performing this month is to shift some of my USD RRIF holdings into my CAD RRIF. This wasn’t something I had planned to do but since my provider has backtracked on allowing me to get paid out of my USD RRIF in USD, I needed a way to keep the USD exposure at a constant-ish level in the overall portfolio. I’ll talk about the USD in my portfolio in a future dedicated post.
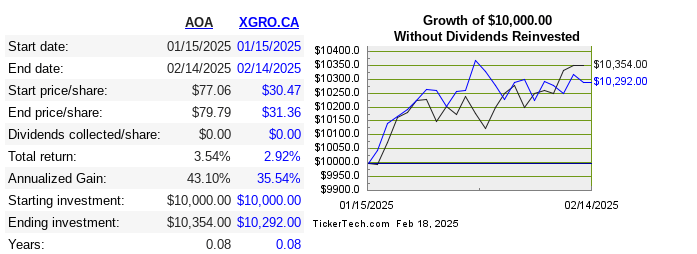
One final note: my retirement savings continue to grow even though I’m now actively removing assets out of it. On paper, this makes perfect sense since an 80/15/5 portfolio ought to grow at a rate greater than my rate of removal. In practice, of course, it’s rather stock market dependent. Here’s the monthly returns for the 2 ETFs that make up the lion’s share of my portfolio7.
- For me, that’s one personal RRIF that has 2 accounts, one for CAD, one for USD, and one spousal RRIF. My spouse has one spousal RRIF in two currencies, and a personal RRIF. The alternative provider RRIF exists because I wanted to give Wealthsimple a try. ↩︎
- For me, two because one each for CAD and USD. The 2 joint accounts are my cash cushion accounts for the VPW methodology outlined here and here. ↩︎
- Completely spreadsheet-driven. I don’t trade on news, analyses, gut feelings, hot tips, or guesses. ↩︎
- I did hesitate a bit because the interest rate on DYN6005 is over 1% higher, but given the amounts involved, I’m clearly overthinking things. ↩︎
- All booked before this current tariff nonsense. Sorry. ↩︎
- Although it does have a 9% exposure to the Canadian market so not 100% “international”. Hard to beat the MER of this, though. ↩︎
- I don’t think this tool accounts for FX so it’s probably not totally accurate. Check out https://moneyengineer.ca/tools-i-use/ for other useful tools. Canadian dollar gained 1.4% against the USD in the past 30 days, per https://www.bankofcanada.ca/rates/exchange/daily-exchange-rates/ so that will reduce the effective return of AOA by the same amount. ↩︎
- “Without dividends reinvested” since these two ETFs only pay out quarterly. There haven’t been any yet. ↩︎