XEQT Shifts again

Stop me if you’ve heard this before, but XEQT, one of my ETF all stars, recently made some changes under the hood1. Specifically, in their words:

XEQT primarily accesses its broad market U.S. equity exposure using …ITOT, a U.S.-domiciled ETF. In certain circumstances, U.S.-domiciled ETFs … are subject to limits on the sale of their shares to non-U.S. domiciled investment funds such as XEQT. Prior to July 2025, iShares Core S&P 500 Index ETF (XUS) had been held as an additional instrument… Effective July 2, 2025, XEQT has replaced XUS with iShares Core S&P Total U.S. Stock Market Index ETF (XTOT). Going forward, XEQT is expected to hold a mix of XTOT and ITOT.

https://www.blackrock.com/ca/investors/en/literature/product-brief/core-etf-portfolios-product-brief.pdf

So, in other words:

  • XEQT isn’t allowed2 to hold “just” ITOT (a broad US market ETF) to cover the US market3
  • XEQT used XUS (the 500 largest US stocks) to get around this restriction until very lately
  • XEQT now uses XTOT which is 99% the same as ITOT to get around this restriction
  • TL/DR: XEQT is now pretty much what it was at the very beginning of 2025

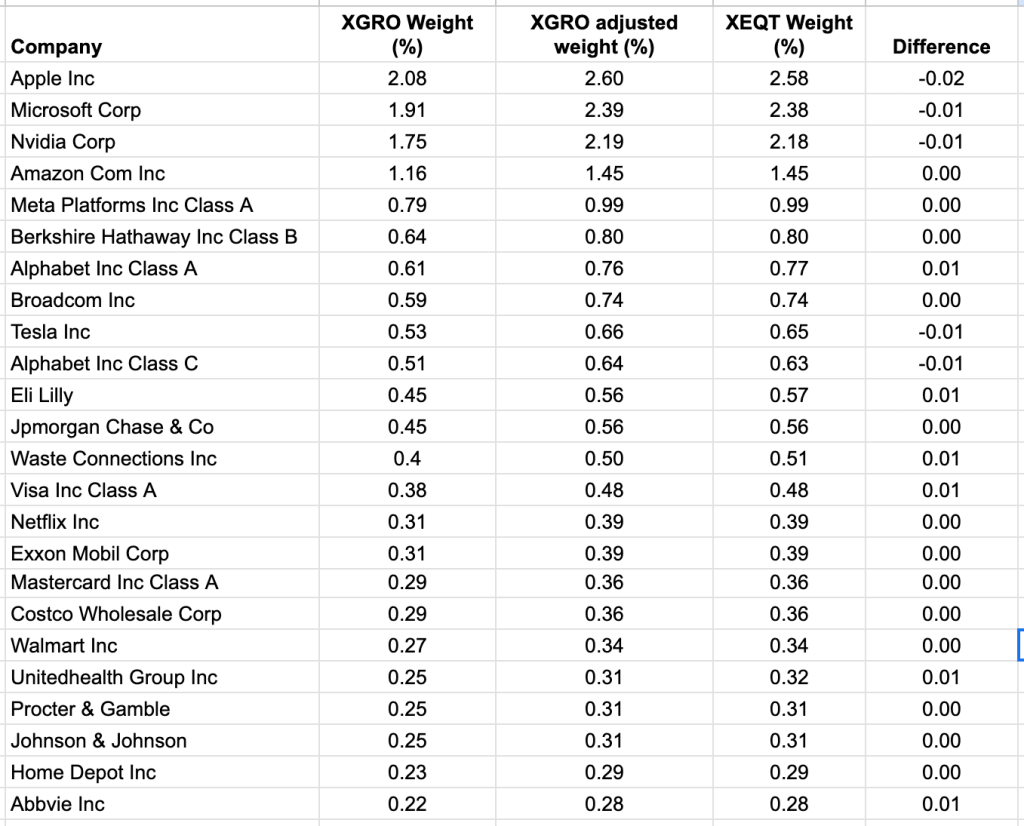
What this means is that lately4, XEQT has reduced its exposure somewhat to the very largest US stocks. I did a little analysis to convince myself, summarized below:

Stock5% delta change XEQT6% delta change ITOT7delta XEQT/ITOT8
Apple-1.7%1.2%-2.9%
Microsoft-2.9%0.2%-3.0%
NVIDIA3.5%6.5%-3.1%
Amazon-1.3%2.3%-3.6%
META-9.2%-6%-3.2%
Berkshire Hathaway-6%-3.4%-2.6%
Alphabet A2.6%6.4%-3.8%
Broadcom-1.0%2.3%-3.3%
Tesla-6%-4%-1.9%
Alphabet C1.6%6.5%-4.9%

The change in the contribution of the largest 10 US stocks has been consistently reduced in XEQT in the past month — that’s what the last column shows. This is what one would expect by removing the “double investing” that was going on previously when XEQT was holding both ITOT and XUS.

To me, that’s all round a good thing, since it provides greater diversification when holding XEQT. I’ve updated the What’s the deal with XEQT? post accordingly!

  1. Thanks to r/JustBuyXEQTfor pointing this out ↩︎
  2. And I don’t know why this is ↩︎
  3. XGRO, my normal go-to in this all-in-family, has not changed at all and continues to hold ITOT and never bothered adding XUS. I guess since the US portion of XGRO is smaller than that of XEQT, it can skirt this restriction. ↩︎
  4. Since July 2 to be precise ↩︎
  5. These are the top 10 US holdings of XEQT, and the top 10 for ITOT. ↩︎
  6. This is % change in the % contribution of each of these stocks between June 30 2025 and July 25, 2025 as reported by the XEQT “underlying aggregate holdings” data on its product sheet. The XEQT change is driven by both the differential in the monthly returns, AND a reduction in the weight of each of the underlying stocks. ↩︎
  7. This is the % change in the % contribution of each of these stocks between June 30 2025 and July 25, 2025 as reported by the ITOT “underlying aggregate holdings” data on its product sheet. The ITOT change is driven purely by differential monthly returns of the stocks. ↩︎
  8. Simply subtract the two previous columns ↩︎

Capped Index Funds: Good Idea?

One nagging concern I’ve heard about index investing1 is that you can end up overly concentrated in a handful of stocks. For example, as of today, per XGRO’s fact sheet, for every $100 I have invested in XGRO, I’m actually investing almost $5 between two companies, NVIDIA and Microsoft. And for every $100 I have invested in AOA, it’s $7 in these two companies. Although that sounds like it might be a significant concentration, I found a way to test the correlation using https://www.portfoliovisualizer.com/asset-correlations. As you can see, XGRO and NVIDIA are not terribly well-correlated:

Not very strong correlation between XGRO and NVIDIA

…even though perhaps I perhaps wish they were (sigh):

Wishing XGRO was more strongly correlated with NVIDIA…

Anyway, if you’re still not comfortable with having too much concentration in your holdings, there are ETFs that limit exposure to any one stock in an index. iShares launched an ETF last year that tracks the S&P 500 while limiting the contribution of any member of that index to 3%. That product is called XUSC, which serves as a complement to its XUS uncapped S&P 500 ETF2. So when you compare XUS’s top holdings to those of XUSC, you can quickly spot the difference:

Top HoldingsXUS (S&P 500)XUSC (capped S&P 500)3
NVIDIA7.86%3.49%
Microsoft7.09%3.12%
Apple5.90%3.07%
Amazon4%3.07%
Meta2.86%2.93%
Broadcom2.49%2.96%
Alphabet class A2%1.66%
Tesla1.73%2.05%
Alphabet class C1.63%1.35%
Berkshire Hathaway1.62%1.93%
Comparing top % holdings between XUS and XUSC as of July 2025

For the TSX, there’s not a full equivalent. The closest pairing for the TSX is XIC4 and XIU:

TickerIndexCapped?# of stocks
XICS&P/TSX Capped CompositeYes214
XIUS&P/TSX 60No615

XIC holds a lot more companies, and in addition to capping any single company, this has the effect of shifting the emphasis to smaller companies. So does this make a big difference in performance? Let’s check using this calculator.

So not much difference; over the past 5.5 years, we see a very slight edge to XIU, the uncapped TSX60 fund.

Whether the relationship between XIU and XIC will be the same as XUS/XUSC is anybody’s guess. In my own case, I don’t own the capped version of the S&P 500, but I do own XIC over XIU, mostly because of its significantly lower MER (0.06% versus 0.18% for XIU).

  1. And my biggest holdings (AOA and XGRO) are nothing more than a collection of index funds: S&P 500, TSX, MSCI EAFE… ↩︎
  2. There’s also currency-hedged variants of these, but I never bother with hedging, it just adds expense and tracking errors. ↩︎
  3. You may wonder why an ETF that advertises itself as capping components at 3% has components that exceed 3%. I also have this question. I suppose they probably only trade when the exception is maintained for a period of time, or perhaps by a more significant margin. Otherwise, they’d trade stocks that hovered around the 3% threshold excessively. ↩︎
  4. The “C” is either for “Capped” or “Composite”, you decide. ↩︎
  5. I can’t explain why a “TSX 60” ETF has 61 assets. Maybe they count cash as the 61st? ↩︎

Is XEQT shift a reason to be concerned?

Quite a lot of my portfolio is tied up in all-in-ones. My Canadian holdings are dominated by XGRO. (If you’re new to the concept of all-in-ones, you may want to give this a read.) I noted with interest a post this week about how XEQT was shifting investments from ITOT to XUS. In plain English, the post was concerned about XEQT’s US holdings moving from the “total” US stock market (ITOT is a mix of small, medium and large companies) versus the S&P 500 (XUS holds the largest 500 companies in the US.)

Now, I don’t hold a ton of XEQT1 (which is 100% stocks); instead, I prefer to hold XGRO, which up until now, I figured was (in my simple way of thinking about such things) “XEQT, except with 20% in bonds”.

The post made me look to see if the report was accurate2. Sure enough, referring to the “Holdings” section of both ETFs, you can see the difference easily.

TickerNameXEQT WeightXGRO weightXGRO Adjusted Weight
ITOTIShares Core S&P Total US Stock34.35%35.16%43.73%
XEFIShares MSCI EAFE IMI26.33%20.76%25.82%
XICIShares S&P/TSX Capped Composite25.88%20.55%25.56%
XECIShares MSCI Emerging4.97%3.93%4.89%
XUSIShares S&P 5008.28%0%0%

“XGRO adjusted weight” takes into consideration that you can’t just compare the weight of a given equity component since XGRO is roughly 20% bonds. “XGRO Adjusted weight” can be read as “the % contribution of this stock to the equity portion of XGRO”. This allows an apples to apples comparison between XEQT and XGRO.

Clearly, there’s 8.28% that XEQT is investing in the S&P that isn’t in the XGRO portion. So this means that XEQT has a slight bias towards the larger portion of the US stock market over XGRO. I like diversification, so I was mildly concerned that perhaps this wasn’t a good idea. So I did some number crunching by downloading the detailed assets from both of these ETFs.

And this is what I found

Comparing % contribution of the largest US holdings of XGRO and XEQT, April 2025

So while there are some differences in the largest stocks I looked at, there wasn’t a consistent bias towards the large stocks. In fact, the sum of the “difference” column shown here is precisely zero.

But why? Shouldn’t XEQT’s double purchasing of large US stocks (via both ITOT and XUS) result in a bias towards the large US stocks at the expense of smaller US stocks? It should, but right now, at the moment, it doesn’t.

This is because XGRO, at the moment, actually has a slightly larger US bias than XEQT, and both of them are actually below target (as per their reference guide):

Current XEQT US equity weightTarget XEQT US Equity WeightCurrent Adjusted XGRO US equity weightTarget Adjusted XGRO US Equity Weight
42.63%45%43.73%45%

This, I suppose, will wash out in the coming weeks/months as both XGRO and XEQT buy up more US stocks to get closer to their targets. In short, there isn’t anything to worry about in the near term; in the longer term, owning XEQT will probably tilt the US equity bias a bit towards larger stocks, which I’m not too fussed about.

  1. I do have a growing amount here because otherwise I’d have a hard time keeping my bond allocation to the desired 15% of my portfolio. ↩︎
  2. I believe this is called “doing the research”. ↩︎

How to read an ETF fact sheet: what’s in a name?

Summary: The standard ETF fact sheet is 4 pages of information a Canadian ETF provider is required to provide. Here’s some tips about what to look for in a name.

Google AI, which is never wrong, tells me that there are more than 1500 ETFs available for purchase on the Canadian market. For those new-to-DIY-investing1, that can seem a little overwhelming. Most of my retirement holdings are tied up in just two asset-allocation ETFs, but prior to retirement, I enjoyed juggling a bunch of index ETFs to roll my own custom asset allocation that I rebalanced manually.

A good skill to have is to understand some of the basic language used in these fact sheets so you can decide if a given ETF is right for you and your investment objectives.

What’s the name of the ETF?

So much is captured in the full name of a given ETF. There’s key words I look for, and key words that I avoid.

Words I look for: “Index” or maybe “Idx”

An index is a list of assets that comply to a set of rules laid out by the index manager. You can think of an index as a detailed recipe for building a list of stocks or bonds. What’s important is that the index is not invented by the company selling you the ETF. The index is a third-party invention, and any ETF company can make use of the recipe in offering you, the investor, a product to buy. The index is the recipe, and the ETF company is the chef that prepares the dish that you buy. You could become a chef yourself, and buy the individual components of the index on your own. However, since some of the indices are comprised of hundreds or even thousands of assets, not every index is realistic for the home chef to create.

An ETF that uses the word “index” in its name suggests it’s a passive ETF, meaning there’s a skeleton crew of managers making trades based solely on what’s in the index. I like index funds because they are generally cheap, and over time, they beat the active traders2 again and again.

Like the ETF market itself, there has been an explosion in the number of indices3 out there created by the likes of FTSE Russell or MSCI. Knowing the names of some of the most popular indices can help:

  • S&P/TSX 60: Canadian stock market’s largest 60 companies. Canadian ETFs that track this include XIU and ZIU.
  • S&P 500: US Stock market’s largest 500 companies. Canadian ETFs that track this include VFV, ZSP, and XUS.
  • Russell 2000: US Stock market’s next-largest 2000 companies after first dropping the top 10004. A Canadian ETF that uses this index is XSU.
  • MSCI EAFE: Developed country index, excluding USA and Canada. Canadian ETFs that use this index include ZEA and XEF5
  • FTSE Canada Universe Bond Index: A broad set of Canadian corporate and government bonds. Sold as ZAG by BMO and XBB by BlackRock/iShares.

A quick search reveals all kinds of very specific index funds: sector based (e.g. “AI” or “Healthcare”) and country/region based (e.g. “China”, “BRICSA”). I ignore these kinds of funds because betting a sector or a region feels like market timing to me, and market timing is a proven loser in terms of long-term returns.

Words I avoid: “Hedged”

“Hedged” means that the ETF uses some kind of strategy to smooth out the ups and downs in the Canadian dollar’s exchange rate. And on one level, it makes sense: if you buy the S&P500, you’re owning a bunch of US stocks priced in US dollars. If the Canadian dollar gets stronger, then your US holdings are worth less in CAD. If the Canadian dollar gets weaker, then your US holdings are worth more to you in CAD. So some funds try to make this variance go away.

I avoid hedged funds for a few reasons:

  • It adds cost and complexity to the fund, two things I dislike about where I choose to invest.
  • It’s imperfect; while it makes the bumps in the foreign exchange rate get smaller, it would be overly expensive to make them go away completely
  • If you hold an asset long enough and reinvest your dividends, it will be a wash in the end, and the extra cost just creates a drag on your returns. For example, let’s compare XUS versus XSP, which are identical, save for XSP’s use of hedging:
The long term cost of using hedging: XUS vs XSP (hedged)

Words I avoid: “Leveraged” / “Bull” / “Bear”

“Leveraged” means “we’re buying stocks using borrowed money”. And while buying stocks using borrowed money can significantly enhance your returns in an up market, the opposite is true in a down market. No free lunch.

Any ETF that has Bull or Bear in the name is making a bet based on short term returns. Buying scratch tickets at Christmastime is enough gambling for me, and gambling has no place in my retirement strategy.

Summing up

Looking at the name of an ETF is a good starting filter to decide if it’s for you. It’s just one piece of many included in an ETF’s fact sheet.

  1. Tips on how to execute on that decision were the topic of a previous post ↩︎
  2. For example: https://www.spglobal.com/spdji/en/research-insights/spiva/#canada ↩︎
  3. One tip I can offer: if more than one ETF exists offering the index, it’s probably a decent index to consider. Be a bit suspicious if only one company has an ETF that mirrors said index — I’d consider it a bit of a fringe offering, of no interest to me. ↩︎
  4. This is normally seen as a “mid cap” or “small cap” index, meaning “US stocks that aren’t in the S&P 500”. I looked at https://www.marketbeat.com/types-of-stock/russell-2000-stocks/ and the first company I recognized was Duolingo. ↩︎
  5. As an illustration of the insanity regarding the explosion of indices, XEF tracks not MSCI EAFE but MSCI EAFE IMI, which adds a few more smaller companies into the mix. But if you refer to https://www.msci.com/documents/10199/11a56df6-0f09-4477-a168-cce49e1719cd you will see that the long term performance differs by 0.01%. ↩︎