Isn’t Yield Important in Retirement?

I had an email from a reader this week (via comments@moneyengineer.ca, I read all the email I get) who was curious about the yield of my retirement portfolio. It occurred to me I haven’t really talked much about this topic, so thanks for the inspiration 🙂

A very common approach for retirement investing is to build a portfolio based on high-quality dividend-paying companies. The best example I can think of is the long-standing “Yield Hog” portfolio written about by the Globe and Mail’s John Heinzl. He updated readers at the end of 2025.

So, using the ETF fact sheets1 and my current holdings, I give you the overall yield2 of my retirement portfolio:

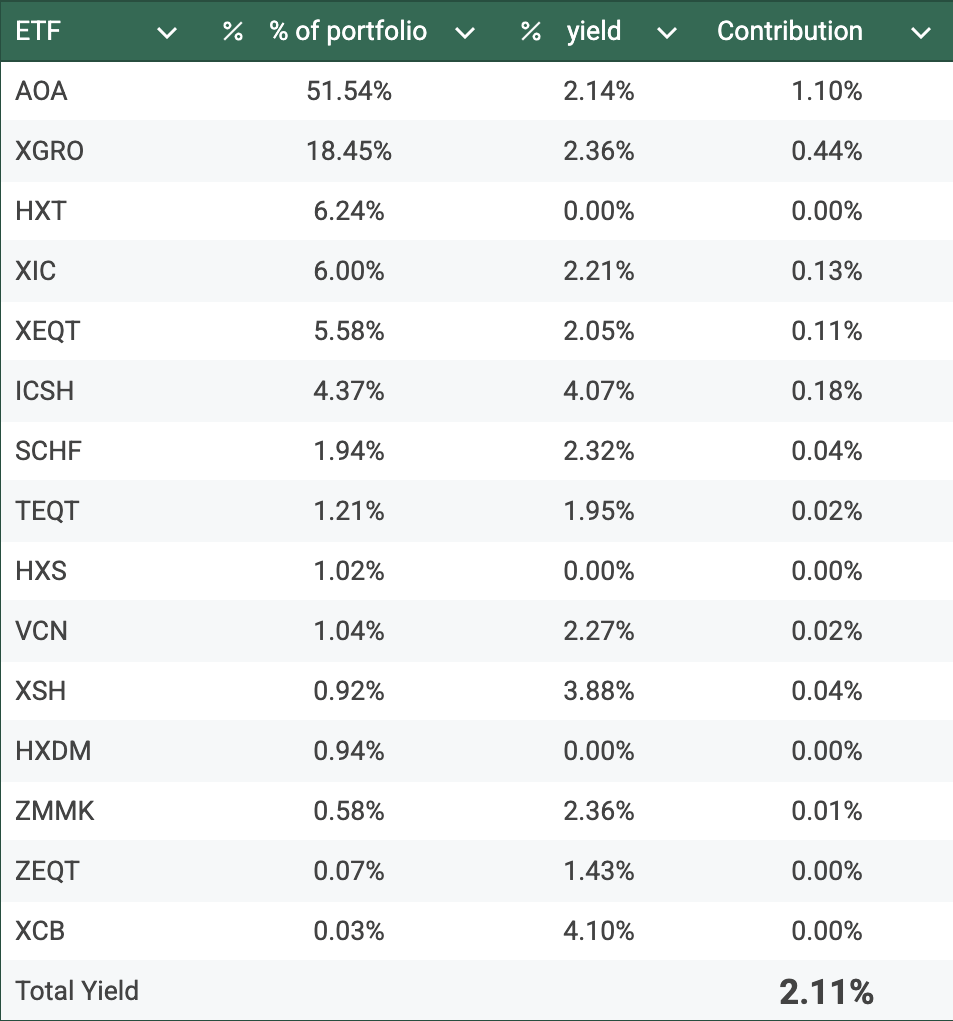
    So the overall yield is just a little north of 2%. For a divided investor, this would seem alarmingly tiny.

    If building an income stream from this portfolio was your objective, you’d either have to have a lot of capital, or very modest income needs, as this portfolio is only generating about $20k in dividends for every $1M invested.

    For me, I’m perfectly happy to dip into capital (i.e. sell ETF units) to fund my retirement. The overall growth of the portfolio is my only consideration, and whether that is in the form of dividends (which, in my portfolio, are always reinvested3) or capital appreciation (i.e. the price of the ETF increases) is irrelevant to me.

    Is it possible to build a dividend-focused portfolio just based on ETFs? Sure. But here I do offer a word of caution. The ETF providers out there have learned how to structure products with spectacular-looking yields that either use leverage (and are hence inherently more risky) or boost their yields by using RoC and giving you back some of your own money. So looking at yield numbers alone without understanding what’s inside the ETF is not a good idea. I took a look at one reasonable product (ZGRO.T) in a previous article.

    The Globe has been my go-to trusted source for such things for a long time; they have annually updated ETF lists in various categories, including dividend ETFs. One that jumps out for me on this list due to its very low cost to own4 (which is something I’m a bit fanatical about, admittedly) is XDIV.

    XDIV’s current yield is 3.93%, and holds large Canadian companies like TD, Royal Bank, Manulife, Sun Life, Suncor Energy, Power Corp…In total it holds only 21 companies, with never more than 10% invested in any one company5.

    Just for fun, I did a head-to-head comparison of XDIV versus XEQT using this calculator that is featured in Tools I Use. I chose XEQT even though it’s a smaller portion of my portfolio than XGRO, but is a better stand-in since XGRO holds bonds.

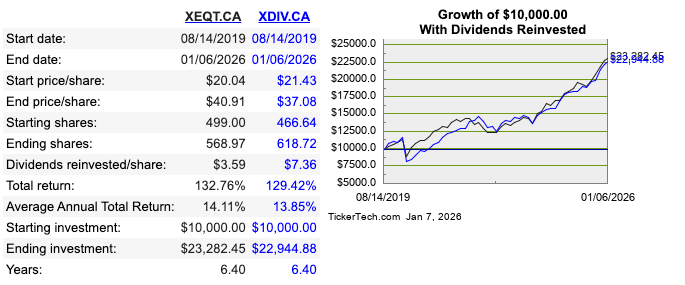
    So here it’s practically a tie. If you reinvested all the dividends for both ETFs, XEQT would have generated about $300 more on an initial investment of $10000 in August 2019.

    But is that really a good comparison? XEQT and XDIV are pretty different:

    • XEQT adds extra fees because it rebalances automatically between its different geographical holdings
    • XEQT invests globally; XDIV is limited to Canada only.

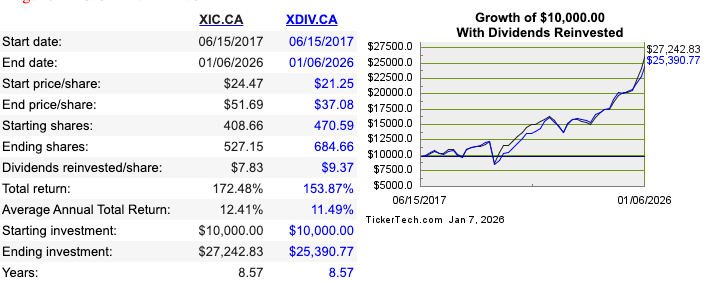
    What if I instead chose to compare the Canadian portion of XEQT to XDIV? (I broke down what’s inside these all-in-ones in a previous article: Under the hood of XEQT et al). XEQT’s Canadian portion is XIC, an ETF that tracks the entire TSX (219 stocks), so let’s run the numbers again over the same time period:

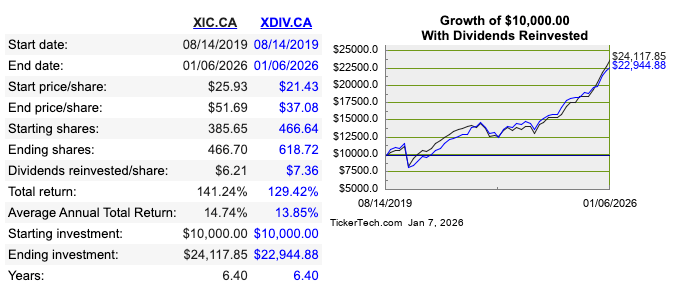
    Here the gap is more noticeable: XIC outperforms by about $1200 in the same time period, assuming all dividends are reinvested. Now, of course, you can see that sometimes XDIV was ahead during this period. I cranked up the timeframe to as far back as I could to see what the results were:

    Adding two more years of retrospective increased the gap by another $800, which is about a 1% per year return advantage to XIC.

    Now of course, you could find counter examples I suppose. But if capital preservation isn’t a concern6, then these results tell me that dividends needn’t be a concern in retirement. Even with my anemic yield stats, my net worth increased in 2025 even accounting for getting paid every month (chart from my latest What’s in My Retirement Portfolio):

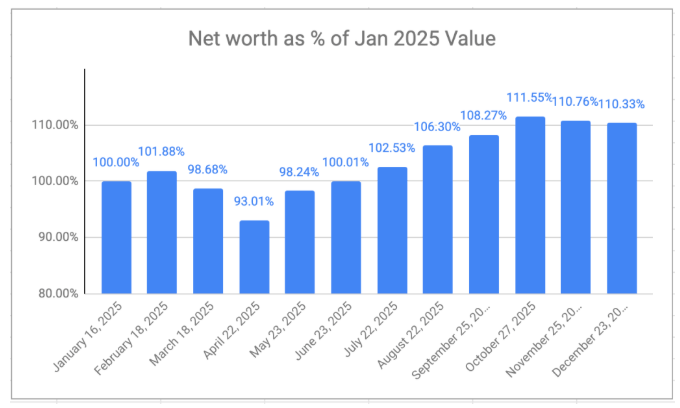
    Every month, I sell XGRO shares to fund my RRIF payments. Every month, I sell some non-registered assets to cover the rest of my salary. The TFSA gets a monthly contribution. Selling shares isn’t bad — as long as those that remain keep growing, I can keep spending7!

    1. TEQT isn’t publishing a yield, so I made an attempt to calculate it based on the Dec 31 distribution. This seems a bit lazy on TD’s part: I get that it’s a new ETF, and 12 months of data isn’t available yet, so you can’t show a trailing yield, but you CAN show the forward looking yield based on the most recent distribution. Banks. Sigh. ↩︎
    2. A weighted average. You may wonder about HXS/HXDM — these are “corporate class” ETFs that by design do not make distributions and instead use accounting tricks to bury that growth inside the ETF price. It’s something I use in my non-registered accounts. ↩︎
    3. Either automatically via DRIP or through my own purchases; it’s a bit of a mix at the moment. ↩︎
    4. A MER of 0.11%, a bargain for this sort of ETF. ↩︎
    5. Otherwise, its tracking index (MSCI Canada High Dividend Yield 10% Security Capped Index) has a TERRIBLE name. ↩︎
    6. For me, it isn’t. I’m not looking to leave a large estate. Die with zero! ↩︎
    7. And if they shrink, so does my spending. That’s the VPW way. ↩︎

    ZGRO versus ZGRO.T: what’s the difference?

    ZGRO and ZGRO.T are both asset allocation funds (aka all-in-ones1) offered by BMO. They hold the same assets, and they both generate the same (dividends-reinvested) returns. But ZGRO.T says it has a yield of 5.65% whereas ZGRO has a yield of 1.73%2. How is this possible? Full disclosure: I don’t own either of these funds because I have historically invested in a very similar-to-ZGRO product, XGRO, instead3.

    Let’s start with a really high level look at these funds4.

    ZGRO vs ZGRO.T, Overview Tab (source bmogam.com)

    The first thing I’ll point out is one of caution: ZGRO and ZGRO.T have very similar tickers and it’s all-too-easy to mix them up. The fund names are also very similar, although ZGRO.T adds the words “Fixed Percentage Distribution Units” to the mix. That’s a clue. The other things we can learn from this first glance is that ZGRO.T is pretty new (Inception Date), is about 1/20th the size of ZGRO in terms of investments (Net Assets), has an identical MER to ZGRO, but whoa, that distribution yield is off the charts. Put simply, if you had $1000 in ZGRO, and $1000 in ZGRO.T, and the last distribution paid was assumed to be constant5, you’d get $11.73 from ZGRO and $56.50 from ZGRO.T over the next twelve months. Huh?

    This is even more puzzling if one takes a look at what each of the two ETFs hold: it’s identical:

    ETF HeldZGRO %6ZGRO.T %
    ZSP – S&P 50037.037.0
    ZCN – TSX Capped20.420.4
    ZAG – CAD Bond13.813.8
    ZEA – MSCI EAFE13.413.4
    ZEM – MSCI Emerg6.76.7
    ZUAG – US Bond5.85.8
    ZMID – US Mid Cap2.02.0
    ZSML – US Small Cap1.01.0
    Cash00

    Comparing top holdings, ZGRO versus ZGRO.T. Can you see a difference? I can’t see a difference.

    I spent quite a bit of time searching on the BMO website trying to get their take on the difference. In a lot of places, (e.g. the simplified prospectus7), the two funds are treated as the same. After nearly giving up, I did come across this document which has a teeny tiny footnote, which I reproduce here:

    These units are Fixed Percentage Distribution Units that provide a fixed monthly distribution based on an annual distribution rate. Distributions may be comprised of net income, net realized capital gains and/or a return of capital. The monthly amount is determined by applying the annual distribution rate to the T Series Fund’s unit price at the end of the previous calendar year, arriving at an annual amount per unit for the coming year. This annual amount is then divided into 12 equal distributions, which are paid each month.

    BMO Asset Allocation ETFs Whitepaper

    So the big difference as I see is is that ZGRO.T attempts to give a stable yield in 12 month chunks. It does this by

    1. Giving you dividends from the underlying assets (so does ZGRO)
    2. Selling underlying assets (and generating a capital gain)
    3. Giving you back your own money (this is known as as return of capital)

    Let’s take a look at the two from a tax perspective (note that this only matters if you were to hold these funds in a non-registered account):

    ZGRO vs ZGRO.T 2024 Distribution Tax Tab (source bmogam.com)

    And here the distinction between the two becomes clearer: ZGRO.T is making good use of Return of Capital (RoC) to distribute a dividend with limited near-term tax implications. But as always, there’s no free lunch — using RoC means that future capital gains will be higher since RoC reduces the ACB8 of the funds in question, and if your ACB drops to zero, you have to treat RoC as a capital gain.

    So when might you consider using ZGRO.T instead of ZGRO?

    ZGRO.T makes sense in a RRIF account. It’s essentially automating some of the steps I have to take every month to get paid (you can see the mechanism I use here). Every month, I have to sell some of my holdings in order to get the RRIF-minimum payment out.

    In a non-registered account, ZGRO.T’s monthly distributions might be useful if you had the need for consistent monthly cash flow; in addition, if you expect to at some point be in a lower tax bracket, it might help you save future tax, since it’s deferring some gains by using Return of Capital. In my case, I don’t see a good reason to use it since I would have to sell existing assets in order to raise funds to buy it, which generates capital gains.

    So, in summary, the two funds are the same from a total return perspective, with ZGRO.T more monthly cash and ZGRO providing more paper gains. In a RRIF account, ZGRO.T automates some of the manual selling needed to execute decumulation. In a non-registered account, the tax treatment of the two is different, and you’d have to work out the numbers to see if it’s a benefit or not.

    1. If you want to read about all-in-ones, https://moneyengineer.ca/2025/01/21/why-you-can-fire-your-advisor-asset-allocation-etfs/ is a good place to start. ↩︎
    2. This yield is calculated by dividing the most recent per share distribution by the share price and multiplying by 12. In essence, this number is the value of the most recent (monthly in the case of ZGRO.T, quarterly in the case of ZGRO) dividend payout extrapolated over the full year. It may or may not represent what kind of yield you get in the future. ↩︎
    3. Why? Inertia. There are minor differences in the makeup of XGRO versus ZGRO but either is a fine choice for the lazy investor. ↩︎
    4. All the tables here are right off BMO’s ETF selector, which is excellent, by the way. ↩︎
    5. ZGRO is currently paying 7.3 cents per share every quarter and this has been stable since 2020. ZGRO.T is currently paying 6 cents per unit held every month and this has been stable since March 2025. ↩︎
    6. As of September 18, 2025 ↩︎
    7. which weighs in at ~450 pages. I’d hate to see the non-simplified prospectus. ↩︎
    8. Adjusted Cost Base. The average per unit price you pay for a share, necessary to track in order to accurately calculate capital gains (or losses). I use adjustedcostbase.ca for this, found in Tools I Use ↩︎