Summary: Although iShares(XEQT/XGRO) and Vanguard(VEQT/VGRO) get all the love, the all-in-ones from BMO and TD are actually the current winners in the “lowest all-in-one fee award”. Given how similar they are to their competitors, I see no reason not to park money there.
I’m a fan of all-in-one1 ETFs in my retirement portfolio. If you’re new to the world of all-in-ones, you might want to start here. There’s at least five competing families of products out there, courtesy of iShares (XEQT, XGRO, XBAL et al), TD (TEQT, TGRO, TBAL et al), Vanguard(VEQT, VGRO, VBAL et al) BMO(ZEQT, ZGRO, ZBAL et al) and GlobalX2 (HEQT, HGRO, HBAL et al). We’ve taken a look at some of them “under the hood”, so to speak, but didn’t really find super-significant differences.
One facet I haven’t looked at yet is the fees each of these companies charge. As I’ve shown elsewhere, small differences can add up if you have significant investments or are holding them for a significant time.
TD and BMO are the low fee winners at the moment, but the gap has narrowed significantly from earlier in the year. I like low fees, and so I’ve started to invest in these families.
Technically called “asset allocation” ETFs, which is good, since asset allocation is how I view my own portfolio. ↩︎
Formerly known as Horizons, which explains the stock tickers used here. ↩︎
Most of the time I use MER (Management Expense Ratio) to report on fees, but since a few of these companies have lowered their Management fees this year, and since MER is only calculated annually, the MER values only become relevant again on Jan 1. They are a few basis points higher than the management fee, but just a few. Most of the cost is buried in the management fee. ↩︎
“Backtesting” is a commonly-used tactic to see how well the portfolio you have (or are considering) would have performed historically. While “past performance does not guarantee future results” it’s better than not knowing.
I stumbled upon valuetesting.io when I was trying to backtest…something, I don’t really remember what I was up to. Anyway, my random internet walk found valueinvesting.io, which seems to be chock full of all kinds of tools that I haven’t looked at, so I’m just going to focus on the backtesting tools, which I did spend a few hours playing around with. You have to navigate to https://valueinvesting.io/backtest-portfolio to access this portion, and if you want to save portfolios, you have to create an account.
So what, in a nutshell, does this tool do? In their words:
Our portfolio backtesting tool allows you to evaluate the historical performance of up to 3 portfolios. We support 2 portfolio types: asset classes and tickers (stock, ETF, mutual funds). Multiple backtesting scenarios are supported such as periodic capital inflows or outflows, allocation rebalancing frequency and leverage type. Our tool provides historical returns, risk metrics, drawdowns and rolling returns information about your selected portfolios.
Let’s take a look at the two kinds of portfolio types they support: asset classes and tickers.
Backtesting using asset classes
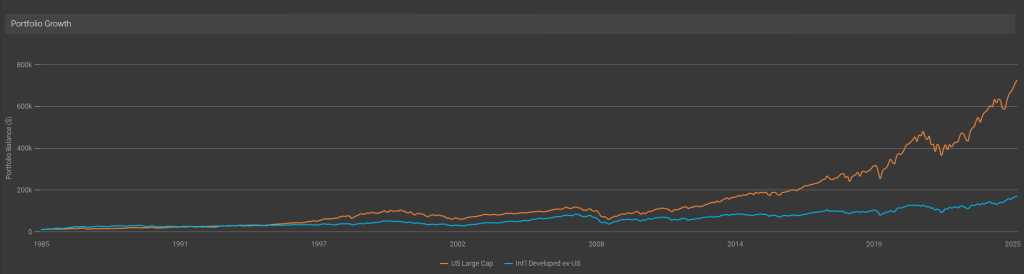
The downside of this tool as a Canadian investor is pretty obvious when you try to build a portfolio using asset classes. (Asset classes are integral to the way I think about my retirement portfolio — you can read more about my approach here.) There’s no “Canadian Equity” category to choose (boo!).
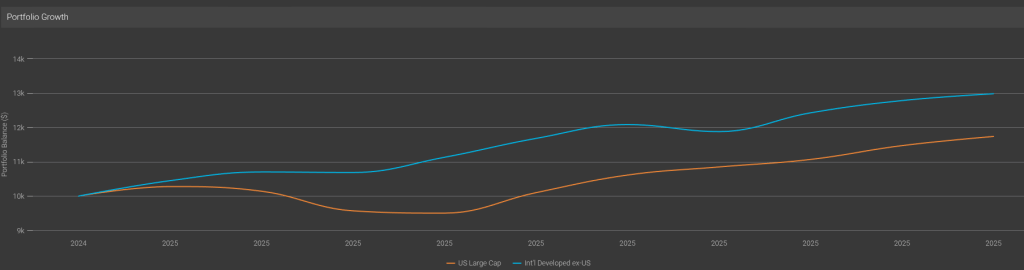
The class that would hold the most Canadian equity would be “Intl Developed ex-US Market”1, so let’s compare that to say the “US Large Cap” (which I take to be a good proxy for the S&P 500).
The good old S&P has left the rest of the developed world in the dust, it seems…Well, except for THIS year:
Anyway, the asset classes are good fun and all, but without a Canadian index to track, it’s not too useful to me. (And, inexplicably, nowhere could I find a definition of any of these in the tool, and an email to the support address remained unanswered at the time of publication). So let’s move on to something more interesting, namely the ticker backtesting!
Ticker Backtesting
As the name implies, this portion allows you to enter tickers, and there’s full and complete support for Canadian ETFs that I tried.
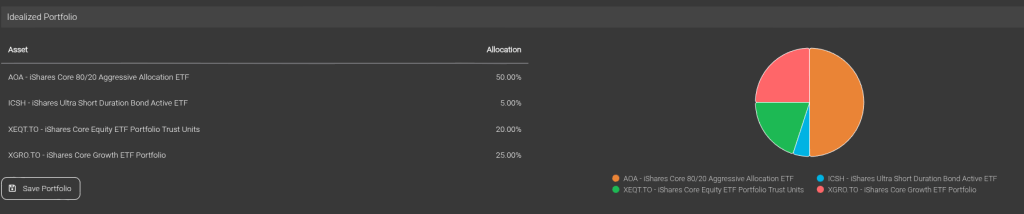
So of course I immediately tried to build my idealized portfolio, which is what my “What’s in my Retirement Portfolio” would look like without the non-registered assets2.
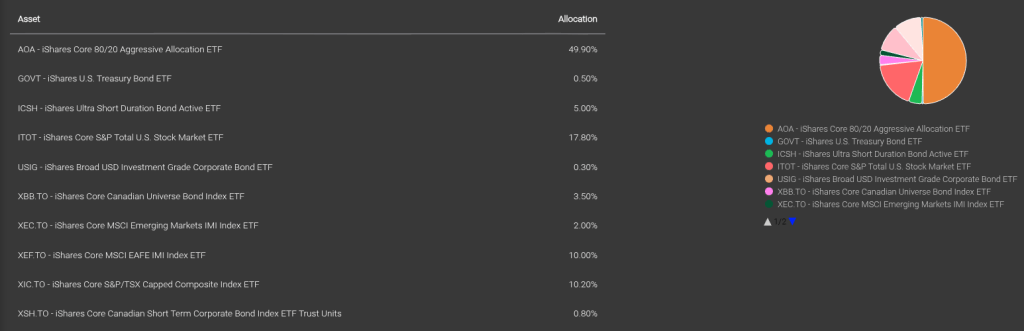
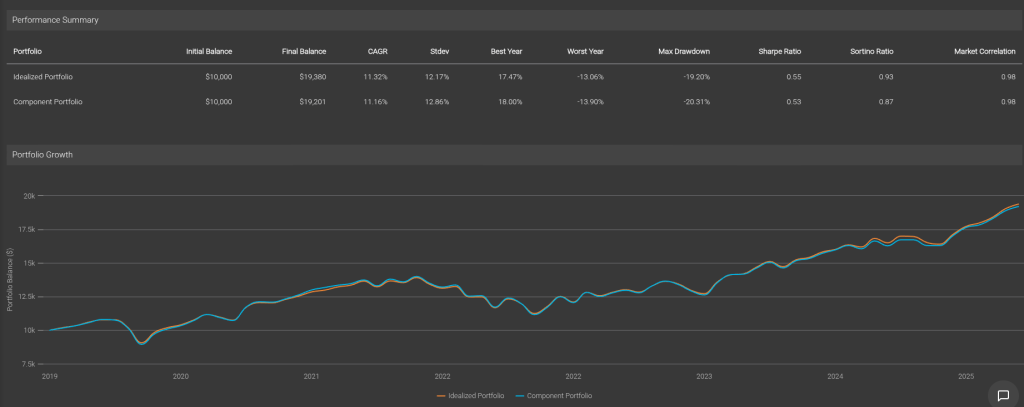
The problem? XEQT and XGRO (two of my ETF all-stars) haven’t been around all that long, and so I can’t backtest very far. No matter, by looking at the composition of XEQT and XGRO and doing some clever math, I can create the equivalent decomposed portfolio:
And I can prove that I got it right by backtesting the two against each other. Pretty good, eh?
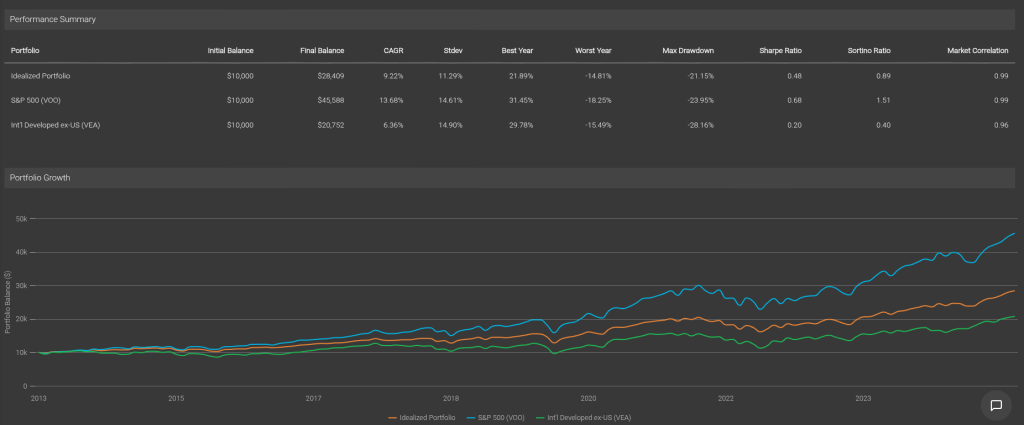
So with my decomposed portfolio at the ready, I can compare its performance long-term against (for example) just buying the S&P 500 index (VOO) or the International Developed ex-US index (VEA).
As expected, my portfolio has quite a bit poorer performance than the S&P, but better than the International ex-US. The bond/cash component smooths out the standard deviations (that’s “volatility”) so my worst years (although still a bit scary) are still a bit less than experience of owning 100% equity.
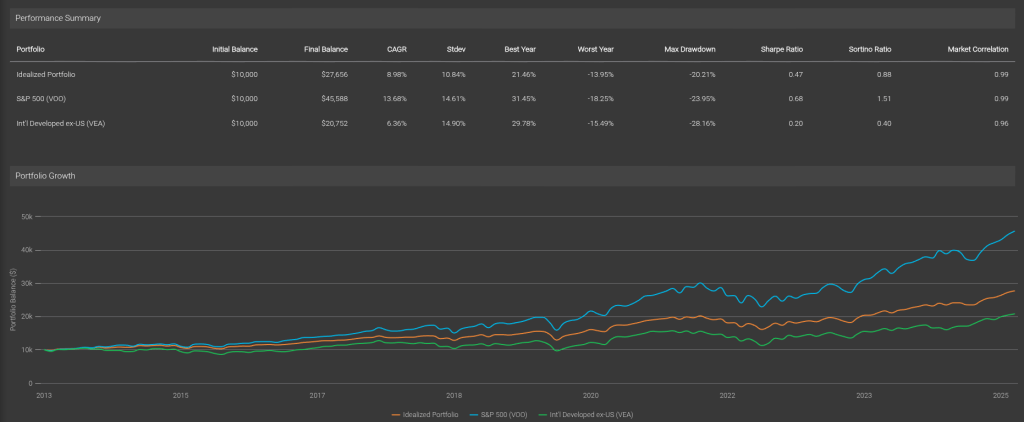
One more thing to look at — this backtesting assumes we don’t rebalance anything. That’s not correct, since that’s one of the benefits of holding ETFs like AOA, XGRO and XEQT — they automatically rebalance periodically. valueinvesting.io lets you choose monthly, quarterly, semiannually and annually. I know for a fact that AOA rebalances twice a year, so we will assume XGRO/XEQT do the same. This is what the result looks like:
This reduces the volatility and the return a bit, which if you stop and think about it, makes sense: equities consistently outperform bonds and cash over time so the rebalancing exercise makes sure the equities remain at an 80% contribution to the portfolio.
Conclusion
The backtesting portion of valueinvesting.io is a good tool to test various combinations of ETFs / stocks you may be interested in. There’s not very much documentation on the site, but it’s easy enough to use. The free account (which requires registration) is enough to get you that far.
Did a bunch of tests and determined that VEA was the ETF that matched the performance of this index most closely. This ETF is about 11% Canadian Equity. ↩︎
The non-registered assets are being sold off, little by little, to fund my retirement. This year, they have provided about 2/3 of my “salary” (RRIF minimum payments gave me the other 1/3), so I am –slowly– drifting toward the ideal portfolio. The AOA percentage in the ideal portfolio will get smaller over time as I transmogrify it as needed to XGRO using Norbert’s Gambit. ↩︎
You can read about my asset-allocation approach to investing over here.
The view post-payday
I pay myself monthly in retirement, so that’s a good trigger to update this post. On November 25th, this is what it looks like:
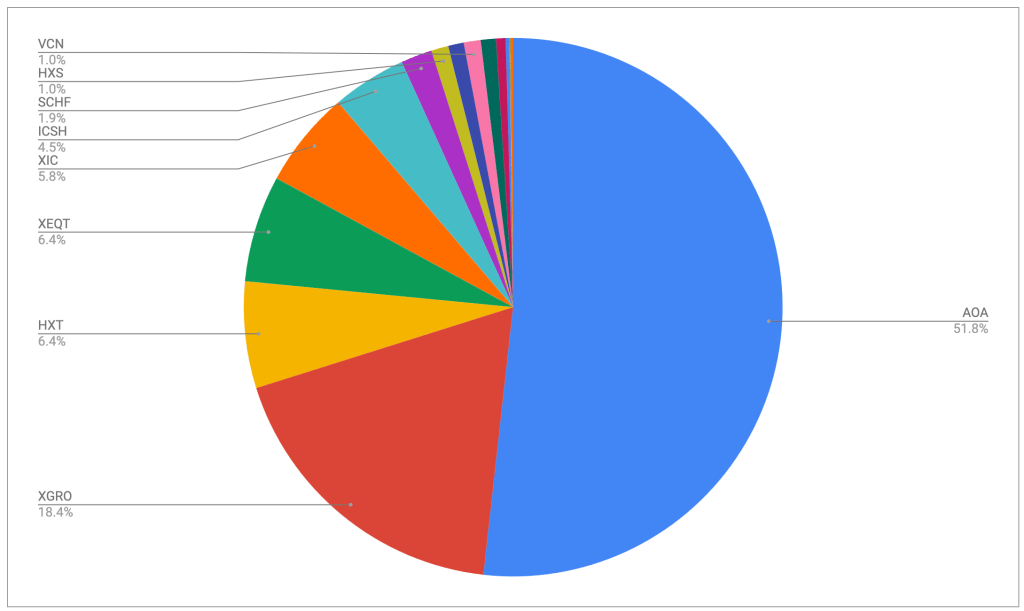
ETF Breakdown of retirement investments, November 2025
The portfolio is dominated by my ETF all-stars; anything not on that page is held in a non-registered account and won’t be fiddled with unless it’s part of my monthly decumulation. Otherwise I’ll rack up capital gains for no real benefit.
No notable changes this month; HXT is down slightly because that’s the fund I sold in my non-registered account this month to help pay the bills. I’ve sold quite a few shares of this fund this year and I’m seeing the capital gains mounting, but it’s around where I expected to be. I try to keep taxes owing reasonable; nonetheless I’m guessing I will certainly be moving to quarterly instalments in FY 2026; that’s the downside of having no withholding tax of any kind this year.
Plan for the next month
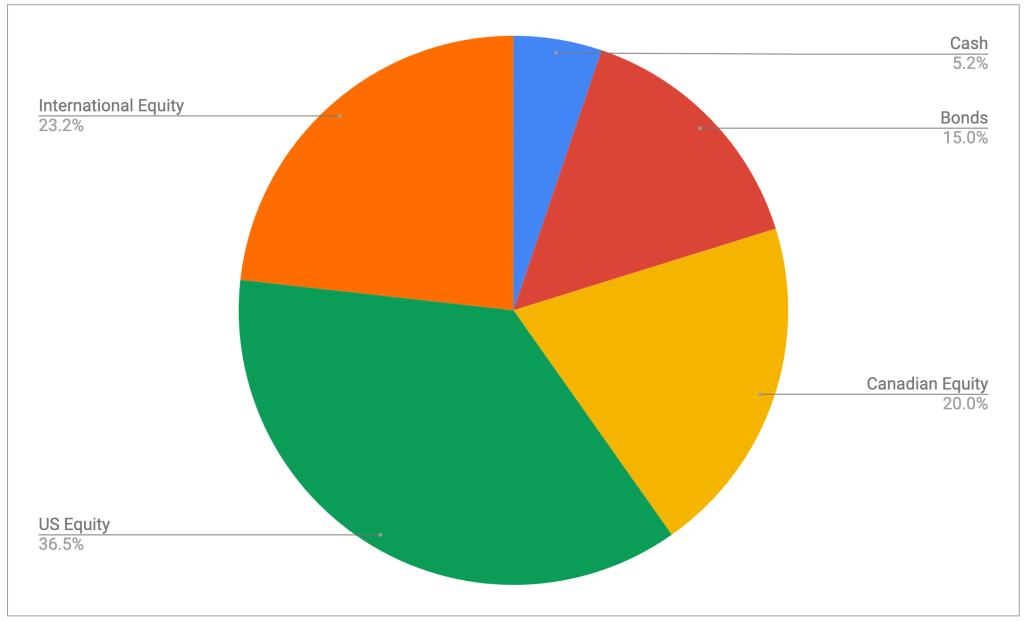
The asset-class split looks like this
It’s looking pretty close to the targets I have, which are unchanged:
5% cash or cash-like holdings like ICSH and ZMMK
15% bonds (almost all are buried in XGRO and AOA)
20% Canadian equity (mostly based on ETFs that mirror the S&P/TSX)
36% US equity (dominated by ETFs that mirror the S&P 500)
24% International equity (mostly, but not exclusively, developed markets)
All looks to be in order from an asset allocation perspective, no need to do anything here. Cash is slightly elevated as a result of the pending closure of the three remaining QTrade accounts and will drift back to the normal 5% over the coming few weeks, I expect.
Overall
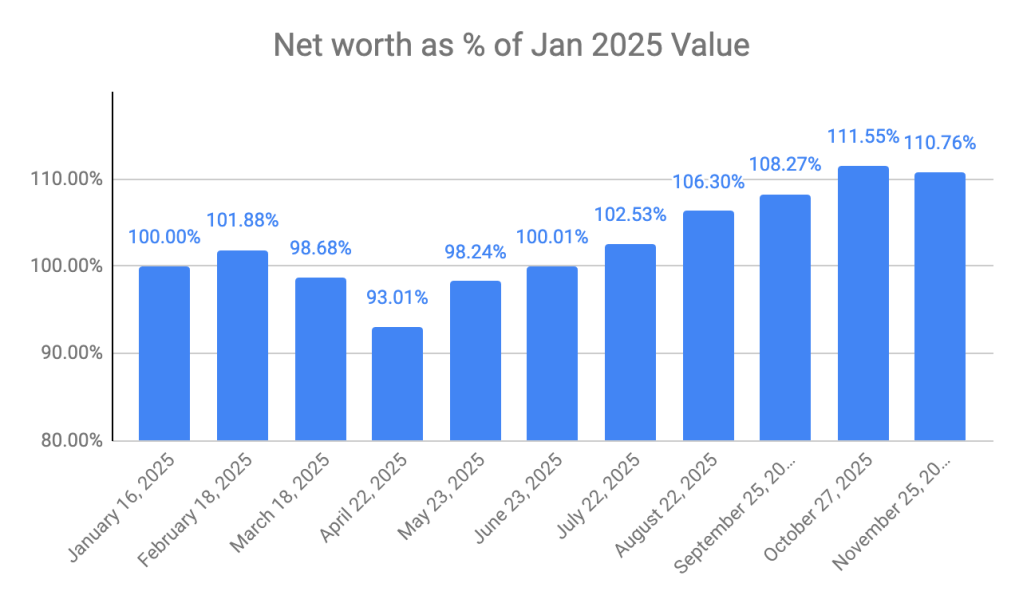
Net worth overall stopped its 6 month winning streak and I’m down slightly month over month. But I will reiterate: my net worth is still growing even though I’m taking a living wage every month. You might think that “decumulation” means “a steady reduction in net worth” but it needn’t be the case. And, in my particular case, my retirement income will include no pensions, so it’s probably a good thing that it keeps increasing overall.
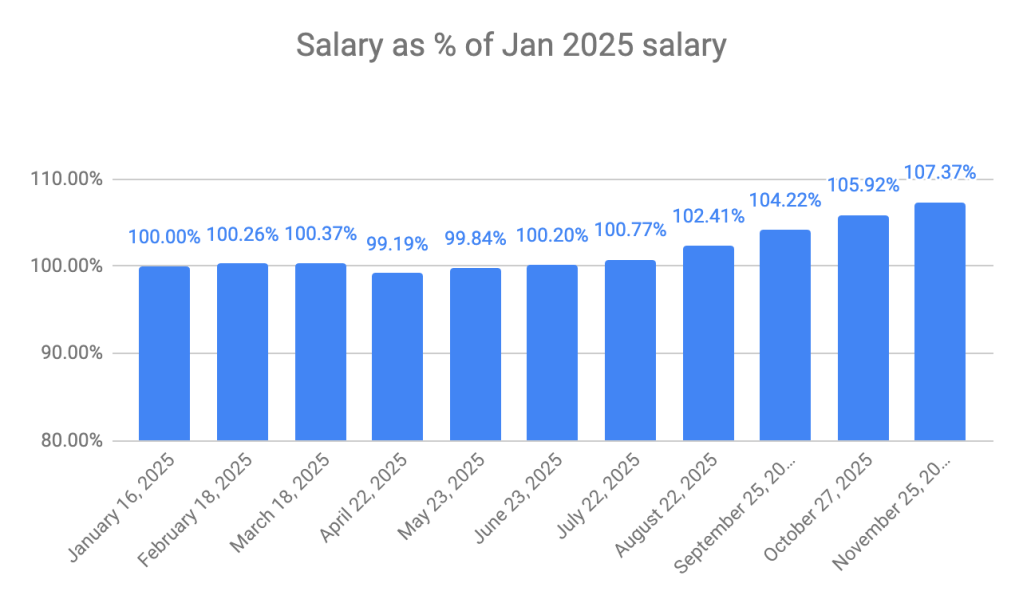
My VPW-calculated salary continues to grow for the 7th straight month in spite of the step back this month in my net worth. That’s a feature of the “cash cushion” that is integral to the VPW withdrawal. It serves as a shock absorber to the monthly ups and downs of the stock market.
Next month will end my relationship with QTrade as I move the final 3 RRIF accounts to Questrade2.
My QTrade one is no more, transferred to Wealthsimple to take advantage of their Summer promotion. ↩︎
I had hoped to move these to Wealthsimple and generate more free money, but alas, they still don’t support self-directed spousal RRIFs, which is very odd indeed. ↩︎
Summary: Vanguard asset allocation funds aka all-in-one funds VEQT, VGRO, VBAL, VCNS. VSIP have reduced their management fees to 0.17%, down from 0.22%, effective November 18, 2025.
It’s a good time to be an all-in-one investor, as I am. New to all-in-ones? Read all about them here.
The summary pretty much says it all. It just got cheaper to own Vanguard’s all-in-one funds. The amount of the reduction amounts to 50 cents for every $10001 invested per year, but compounded over many years, and multiplied by however much you have saved for retirement, it can be a surprisingly large number.
All-in-ones are much cheaper than either roboadvisors or your typical financial advisor, but as we studied before, they’re not without some cost, so fee reductions are always welcomed. Vanguard joins TD and BMO in reducing the cost of their all-in-ones. We looked at the makeup of each of these funds lately; there’s not a huge amount of difference, no matter which one you pick.
Anyway, you may note that Blackrock’s XEQT/XGRO/XINC family is now the most expensive of the lot; there’s no reason for that to be true given the competitive landscape. I would expect Blackrock to follow suit, or if not, I’ll probably be making some moves to get to lower fees, since a lot of my retirement portfolio is currently tied up in XEQT/XGRO. ZEQT/ZGRO I think is the closest in makeup to the XEQT/XGRO family.
Of course, if you only have $1000 saved for retirement, you have other worries. ↩︎
Do you ever wonder about the differences between, say, XEQT and VEQT? Or XGRO and TGRO? Of course, you could ask Reddit1, read an article from a trusted source (ahem), or you could investigate it yourself.
How?
Well, my usual starting point is to google “<trading symbol> ETF”, for example “XEQT ETF”. For popular ETFs, this often generates hits for competitive products, so do be careful of that minefield.
But really, there’s a better way. You can instead google “<trading symbol> fact sheet”, for example “XGRO fact sheet”. In my unscientific tests, this search yield the actual fact sheet for the ETF in question as either the 1st or 2nd result — it’s a pdf file in all the cases i tried.
So what’s the fact sheet, and what’s it all about? Let’s hand it over to the pros:
The ETF Facts is a four-page document that summarizes key information about an ETF in a simple, accessible and easily comparable format. It is designed to help you make an informed decision about your investment by including information such as a fund’s investments, risk rating, past performance and the costs associated with owning it.
The highlights for me about the ETF fact sheet are:
It’s short. 4 pages, and generally the most interesting bits are on pages 1 and 2
It’s “easily comparable”. The format is always the same, allowing for an easier side-by-side looksee.
It’s got information about what the fund invests in. If you hold multiple ETFs, knowing what’s behind each one will help you avoid inadvertently piling on to one segment of the market2.
So let’s take a quick look at my number one Canadian holding, XGRO, to see what it’s about.
Recording the above video taught me that XGRO changed significantly back in 2018, so looking at its performance prior to that is no longer an apples-to-apples comparison. After a bit of searching, I found that XGRO used to be called CBN, which had a MER of about 0.75%. You can read a bit more about that at Canadian Couch Potato, an excellent resource, by the way.
And, inexplicably, people reliably ask this question week after week after week… ↩︎
I don’t make segment bets; maintaining my asset allocation percentages (36% US Equity, 24% International Equity, 20% Canadian Equity, 15% Bonds, 5% cash) is the only metric that matters to me. ↩︎
This is the Ontario regulation; because we like bureaucracy in this country, every province has a securities regulator 😦 ↩︎
And I assume this is also the case in the USA since all the US-based ETFs I own have fact sheets. But I couldn’t find a specific regulation about that. ↩︎